
August 11, 2020
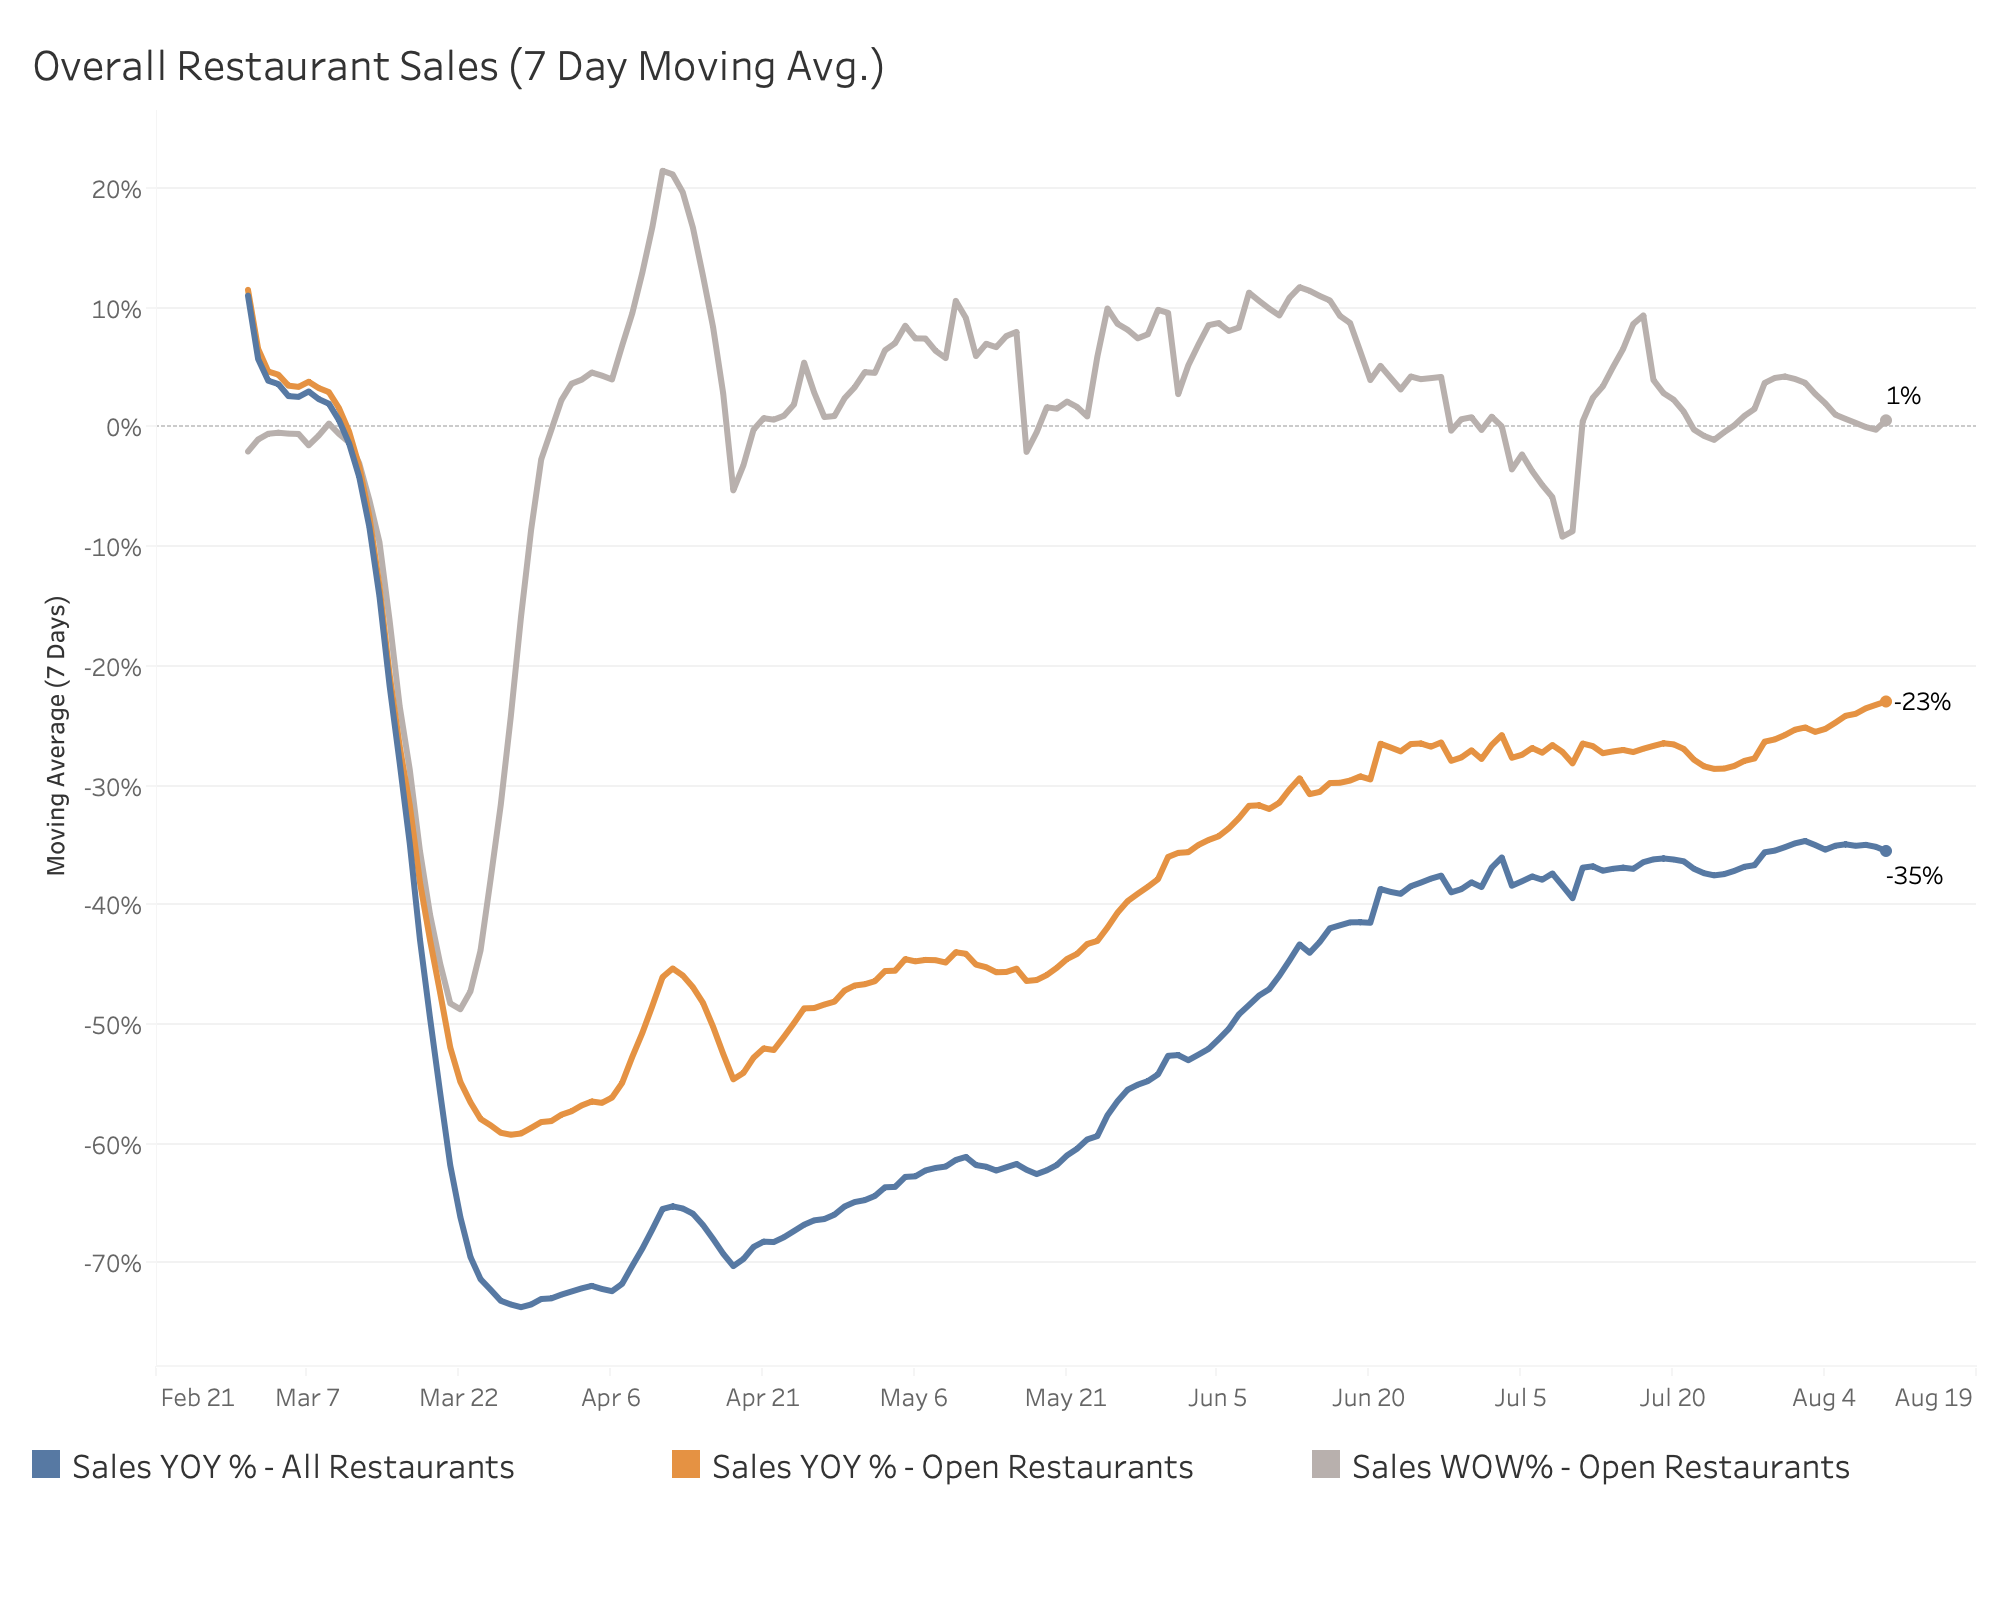
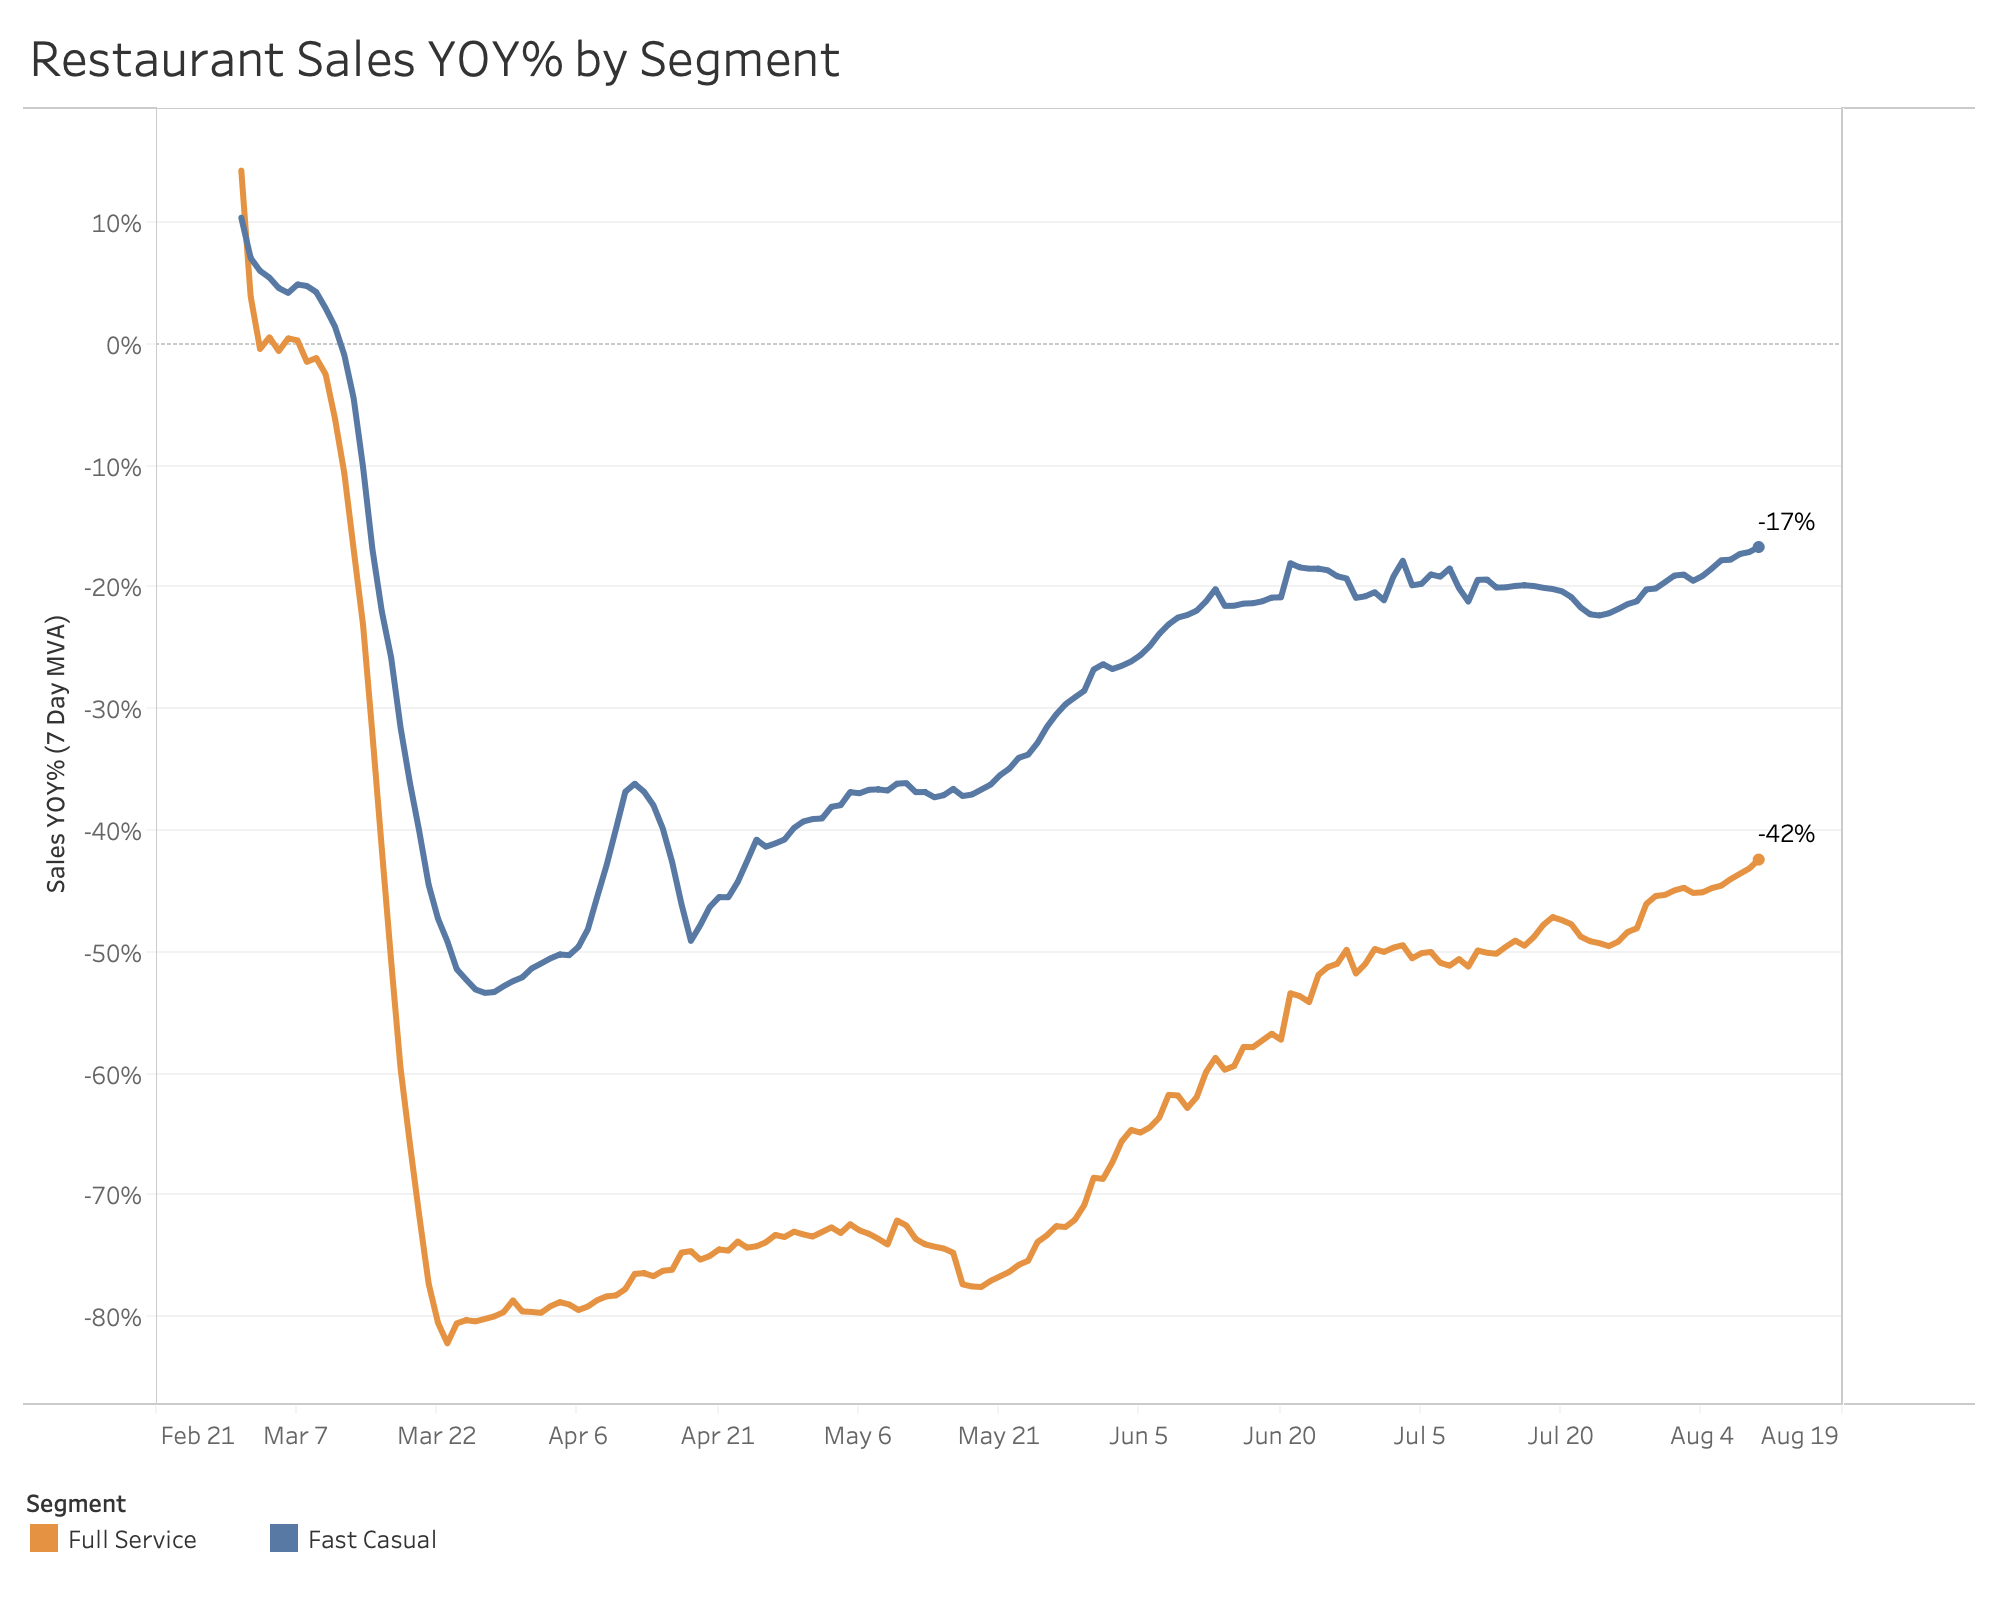
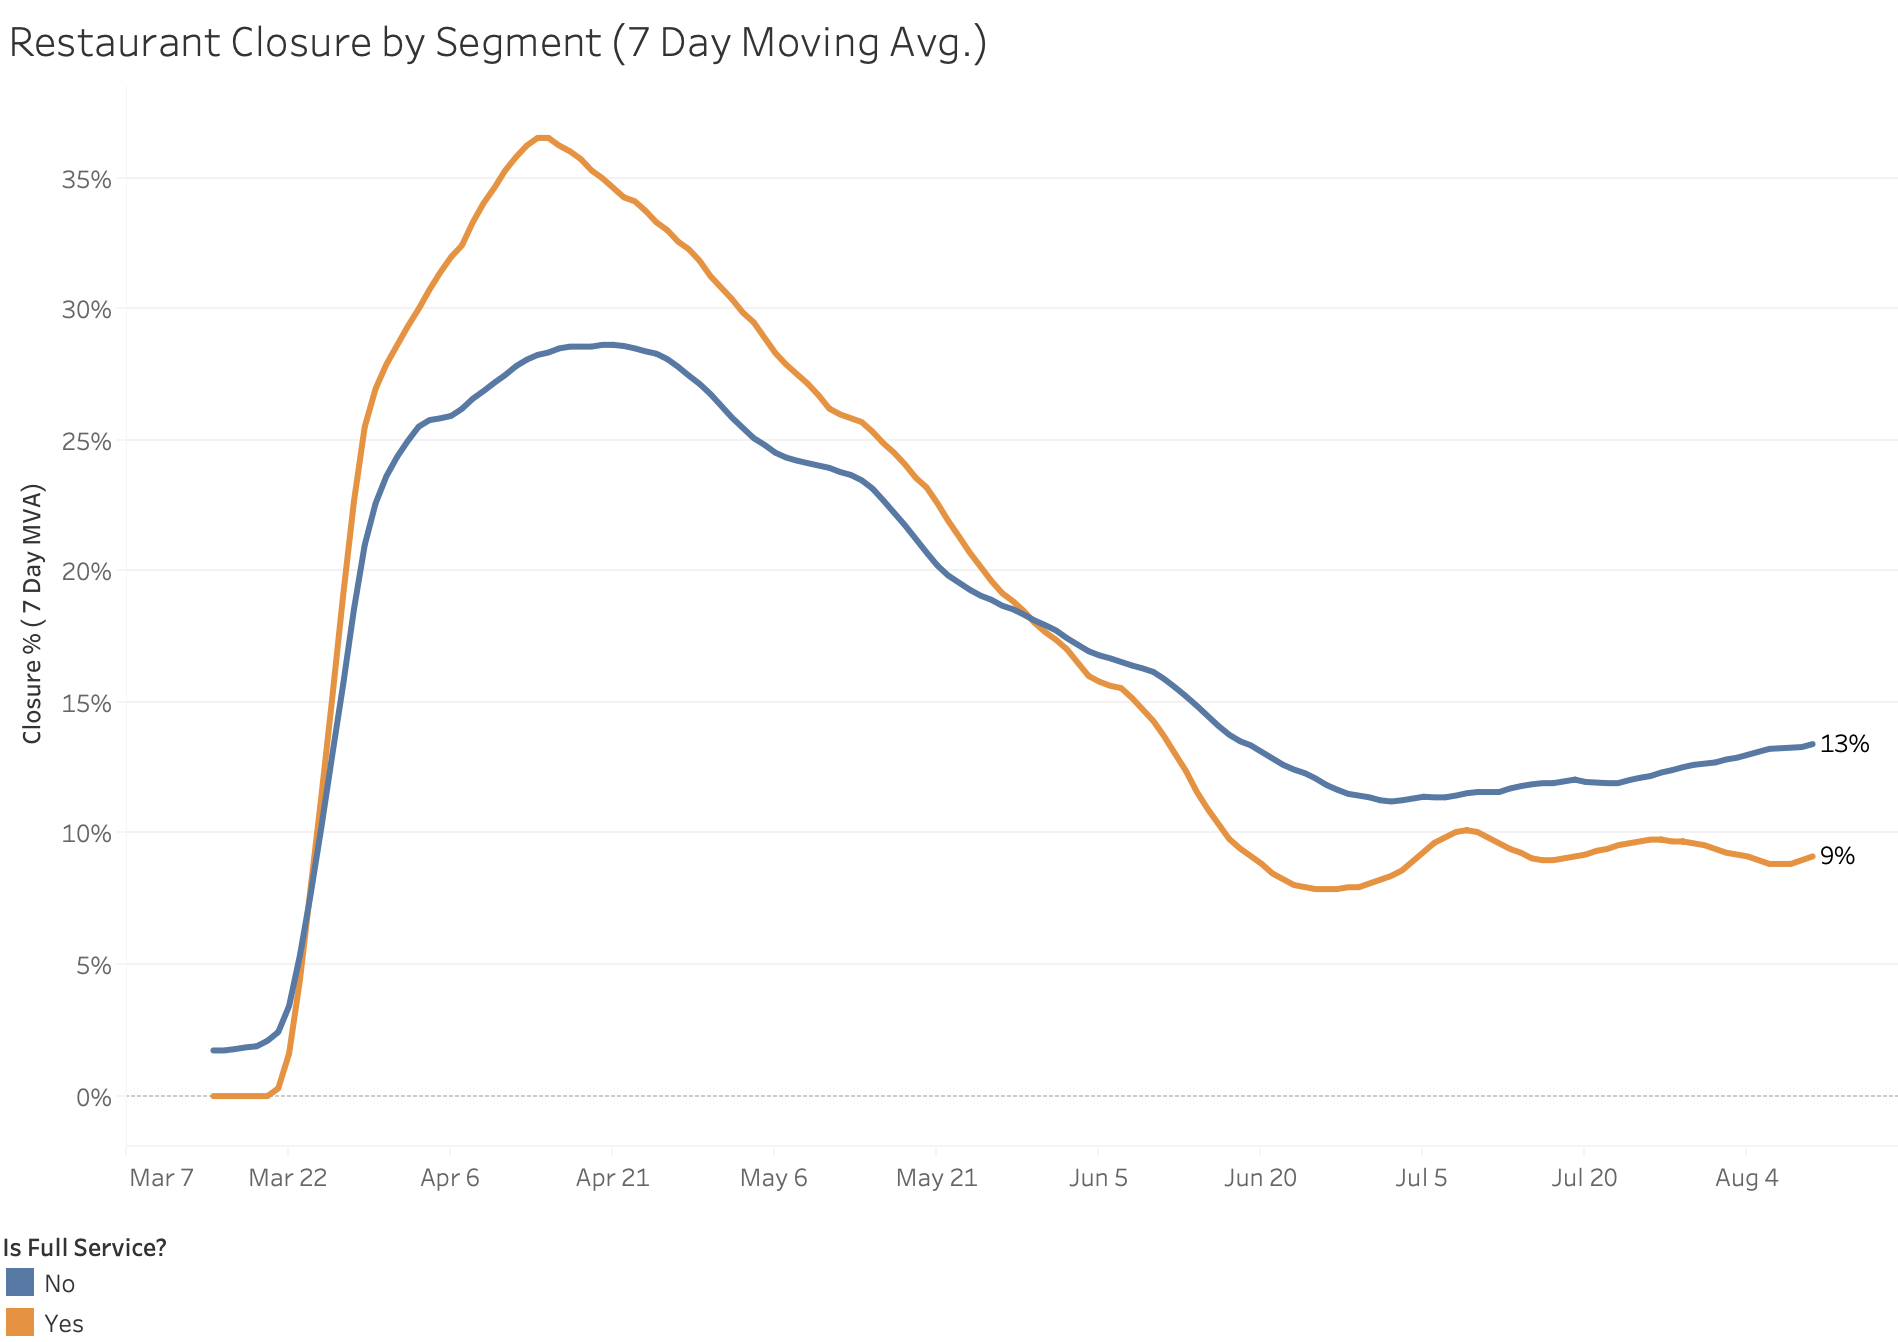
Decided to switch it up today and bring back our full service vs fast casual views – giving our regional stats a break since the numbers have been relatively stable across the country. You can see the fast casual vs full service year-over-year sales trends and closure comparison below.
Fast casual has certainly fared a bit better and while the upward curve isn’t as steep as it was (or as we want it to be!), still good to see both year-over-year lines trending up.
We will still be watching the regional numbers every day so if we see any shifts, or if reopening guidance begins to change, we will be sure to include them here as well.
You can find the full breakdown below.
Stay Safe,
Bo
P.S. For those following along on these notes, but are not a MarginEdge client, we would love to include your numbers in our data set and continue to build out the value of the reporting. We are giving our MarginEdge Lite product for free. This little tool connects your POS to accounting system and creates journal entries – hopefully time saving for you while increasing our sample size as we track recovery across our network. Obviously no obligation or commitment, just an offer for those interested!
Email Updates
Sign up to receive our emails for sales data, updates and resources as our community navigates Covid-19.
SIGN UP
Tag(s):
Metrics