
August 6, 2019
X Factor in July Sales?
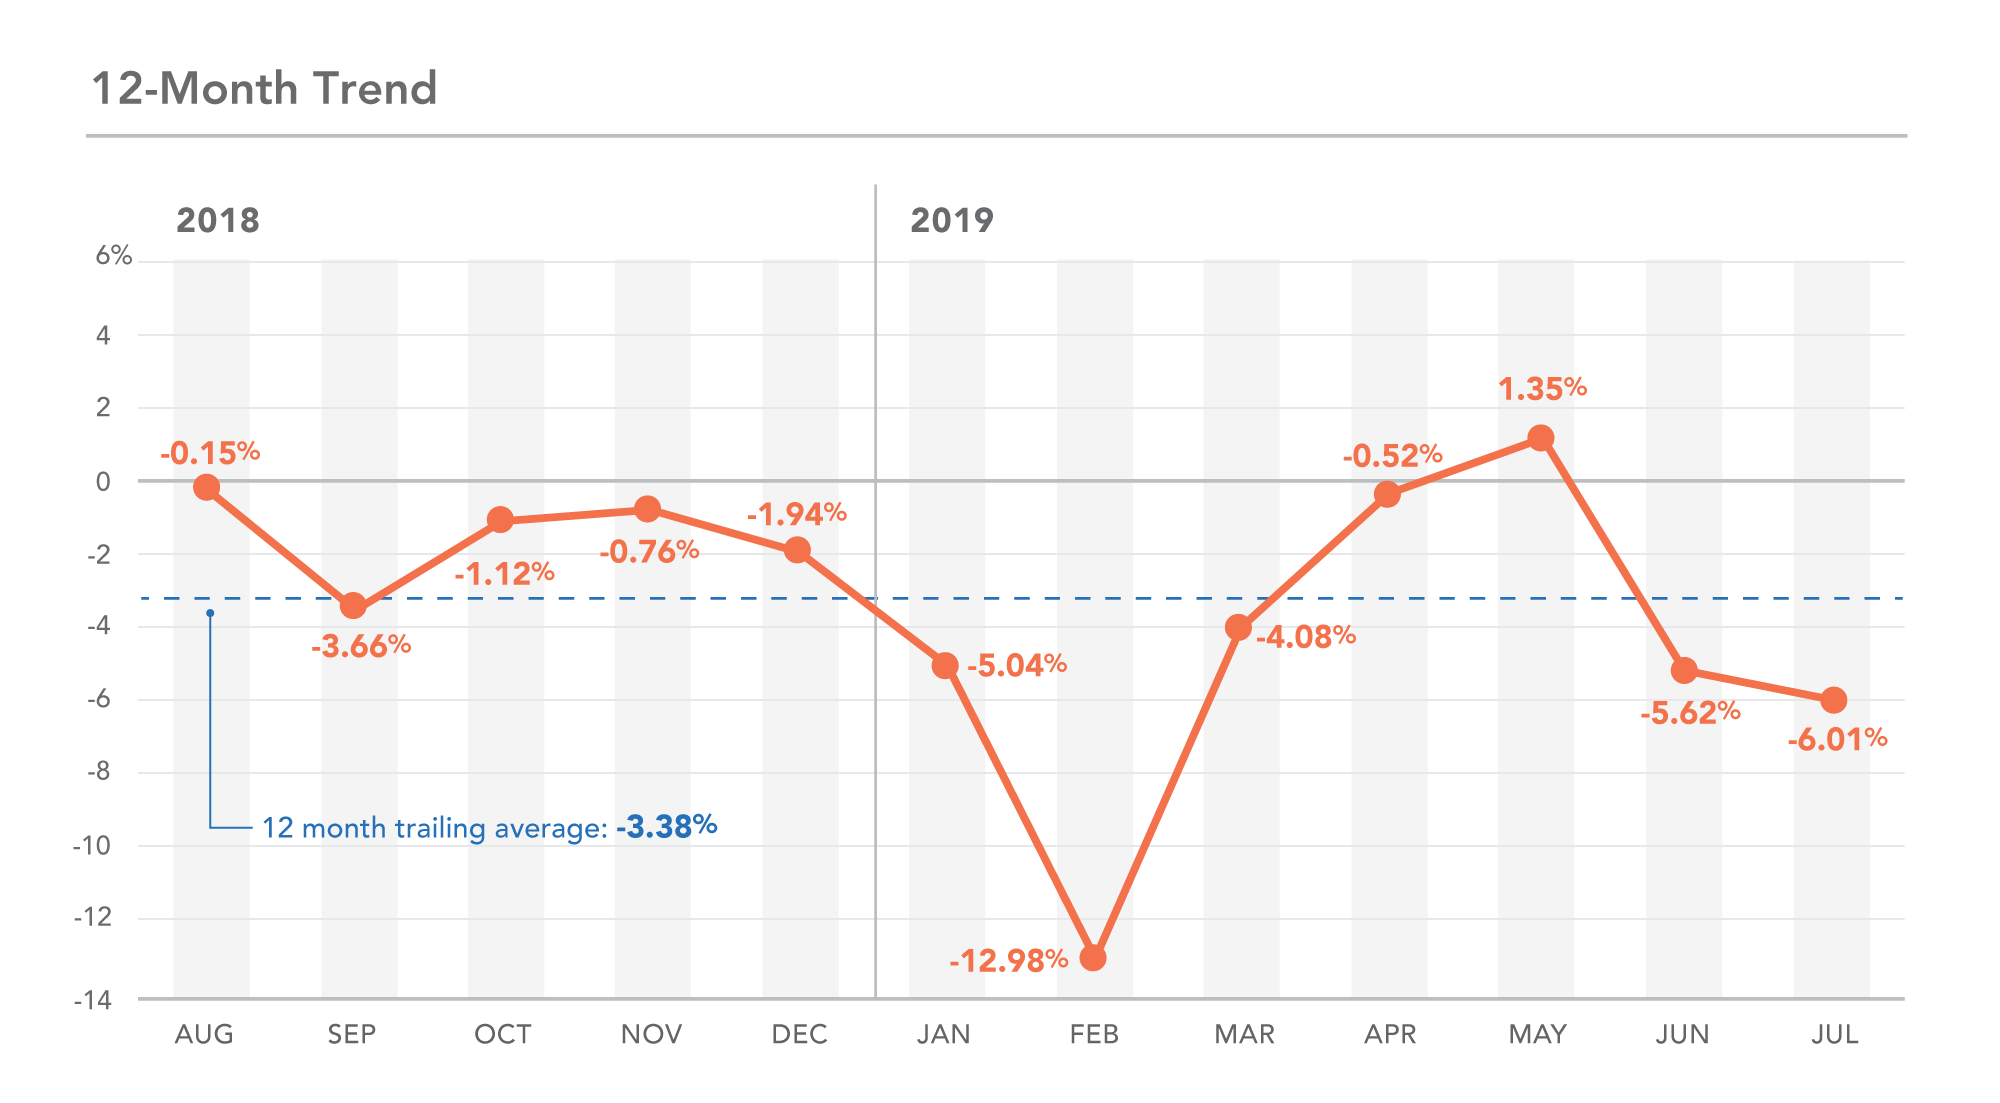
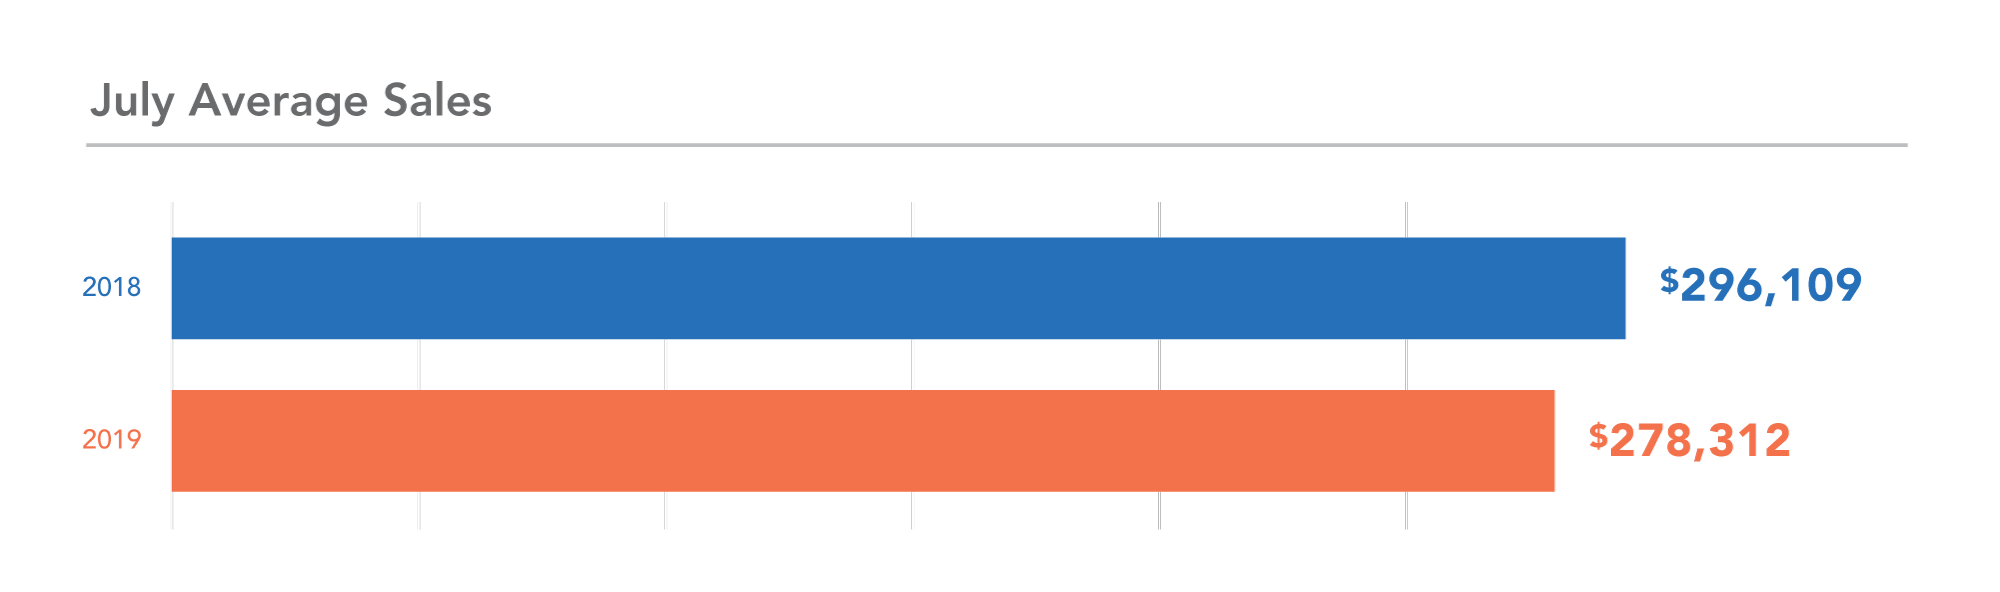
It was another damp month in the Minneapolis region, area restaurants included. It’s been the fifth wettest year in the Twin Cities since records began in 1871… and sales are similarly soggy for the trailing 12 months, down just over 3%. July year-over-year was subdued, down about 6%, but that’s possibly because of the timing of the Summer X Games. The extreme sports showcase again returns to the Twin Cities, and with it, an estimated 90,000 visitors, injecting $42 million into the local economy. However, in 2018 the annual event took place in July, whereas this year’s activities have shifted to early August, moving the economic impact by a few weeks.
About these metrics: The MarginEdge monthly snapshot of Minneapolis/St. Paul restaurant sales is based on a sampling of 50+ area restaurants ranging from fast-casual to full-service.