
September 9, 2020
August made major moves.
While Minneapolis sales for open restaurants are still down -30.1% compared to the end of August last year, here’s a piece of good news – it’s about 10% better than how last month ended. July year-over-year sales were -38.8% of last year, and here’s August at -30.1%. That’s a big climb to accomplish in one month! Now if we could just do that again in September…
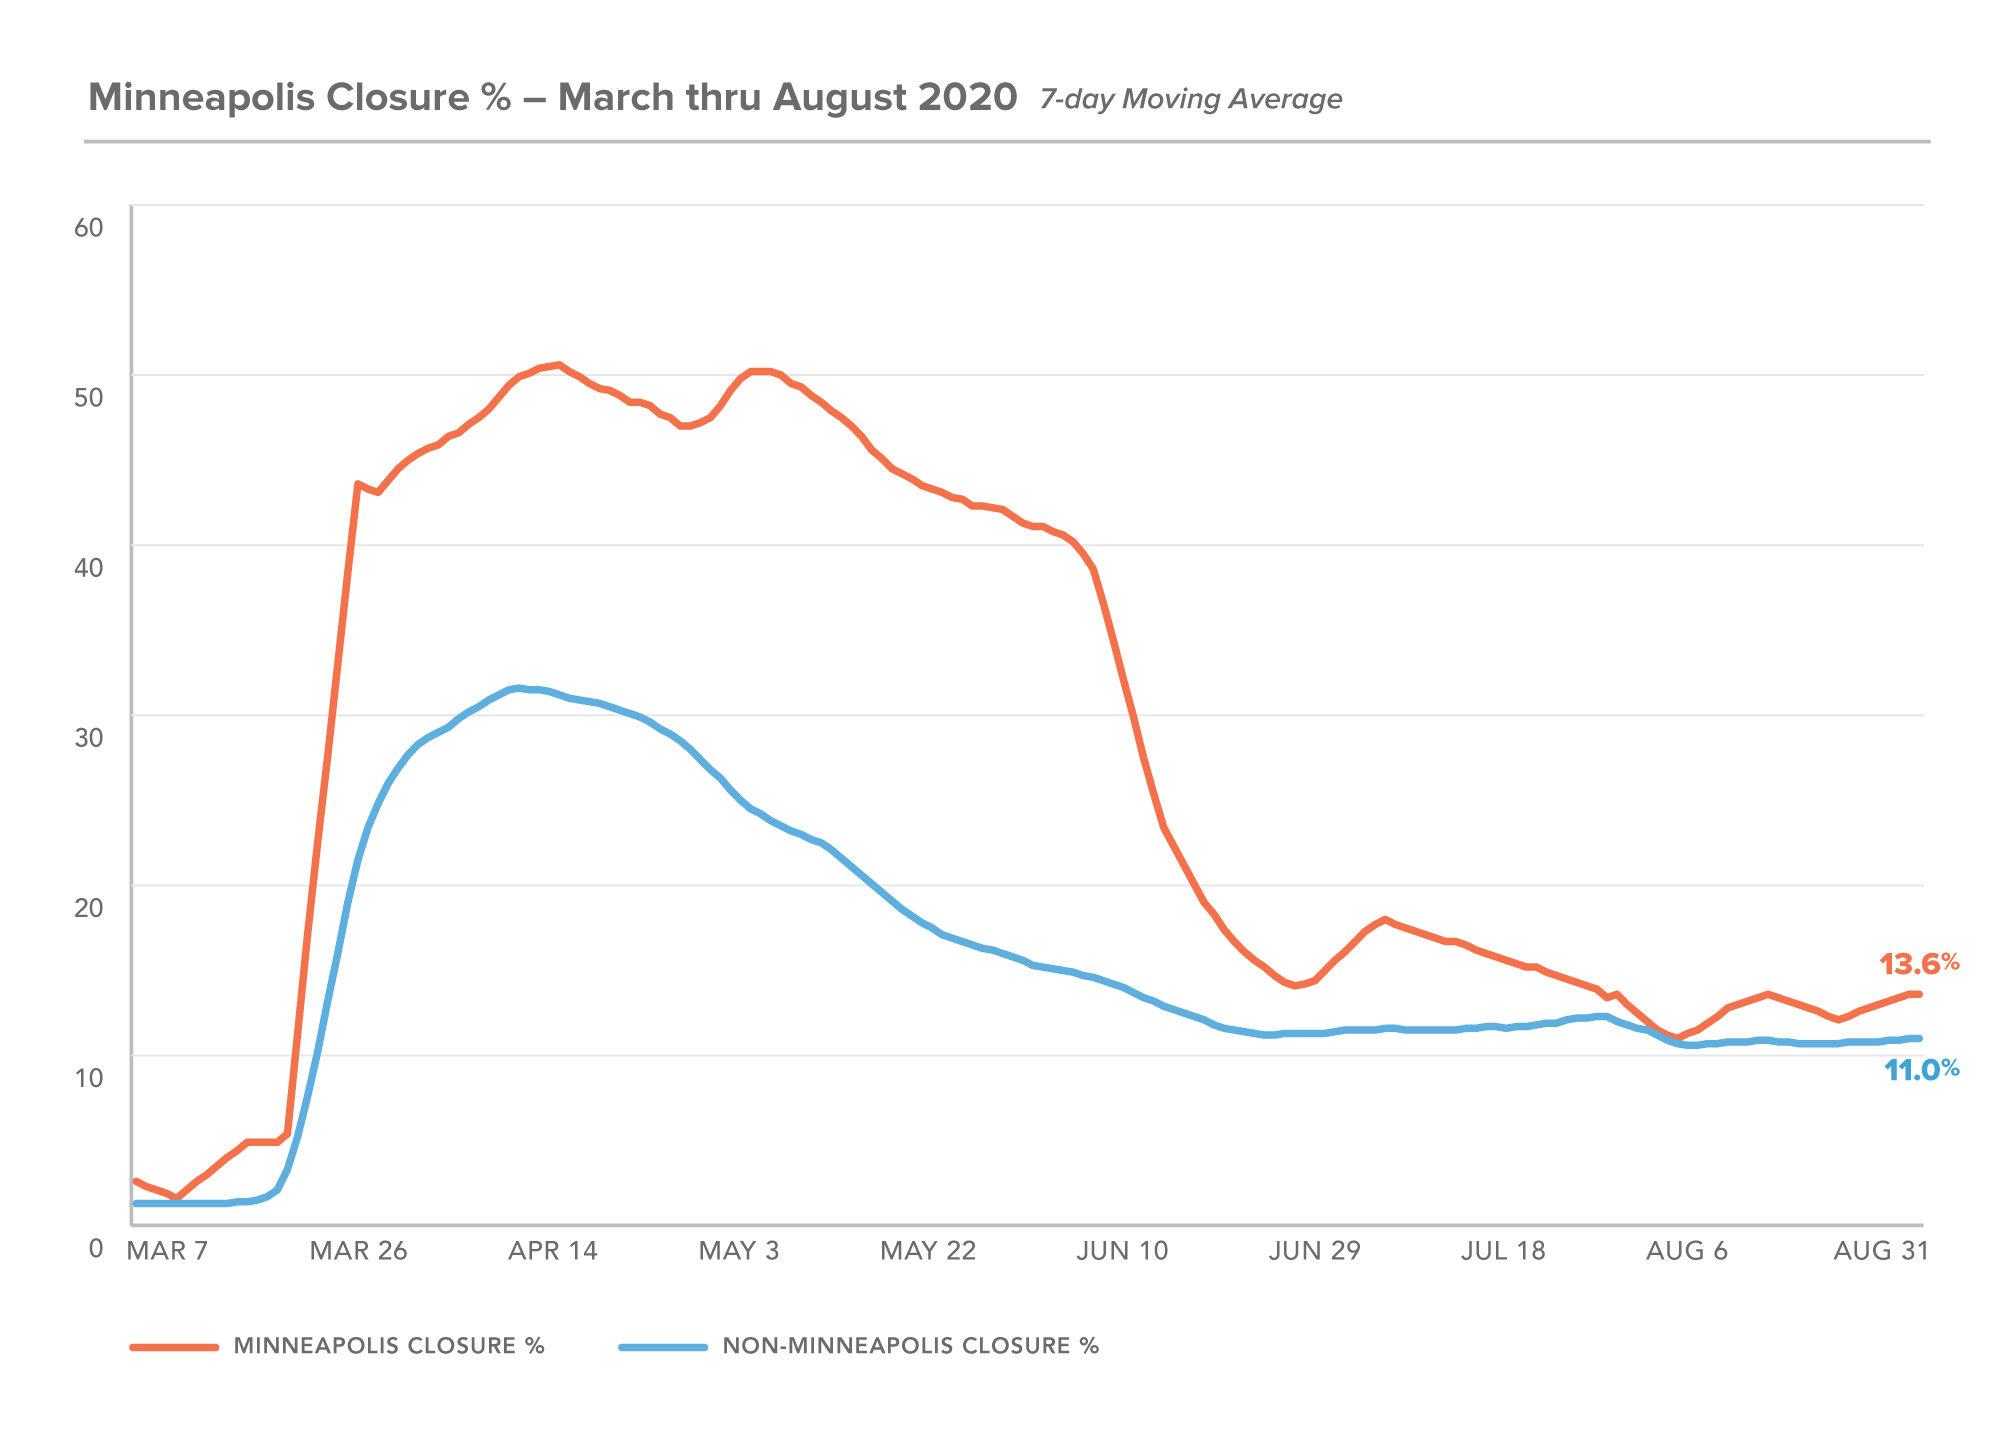
The percent of closed restaurants (either temporarily or permanently) stayed about the same between July and August, which was also true for the rest of the country.
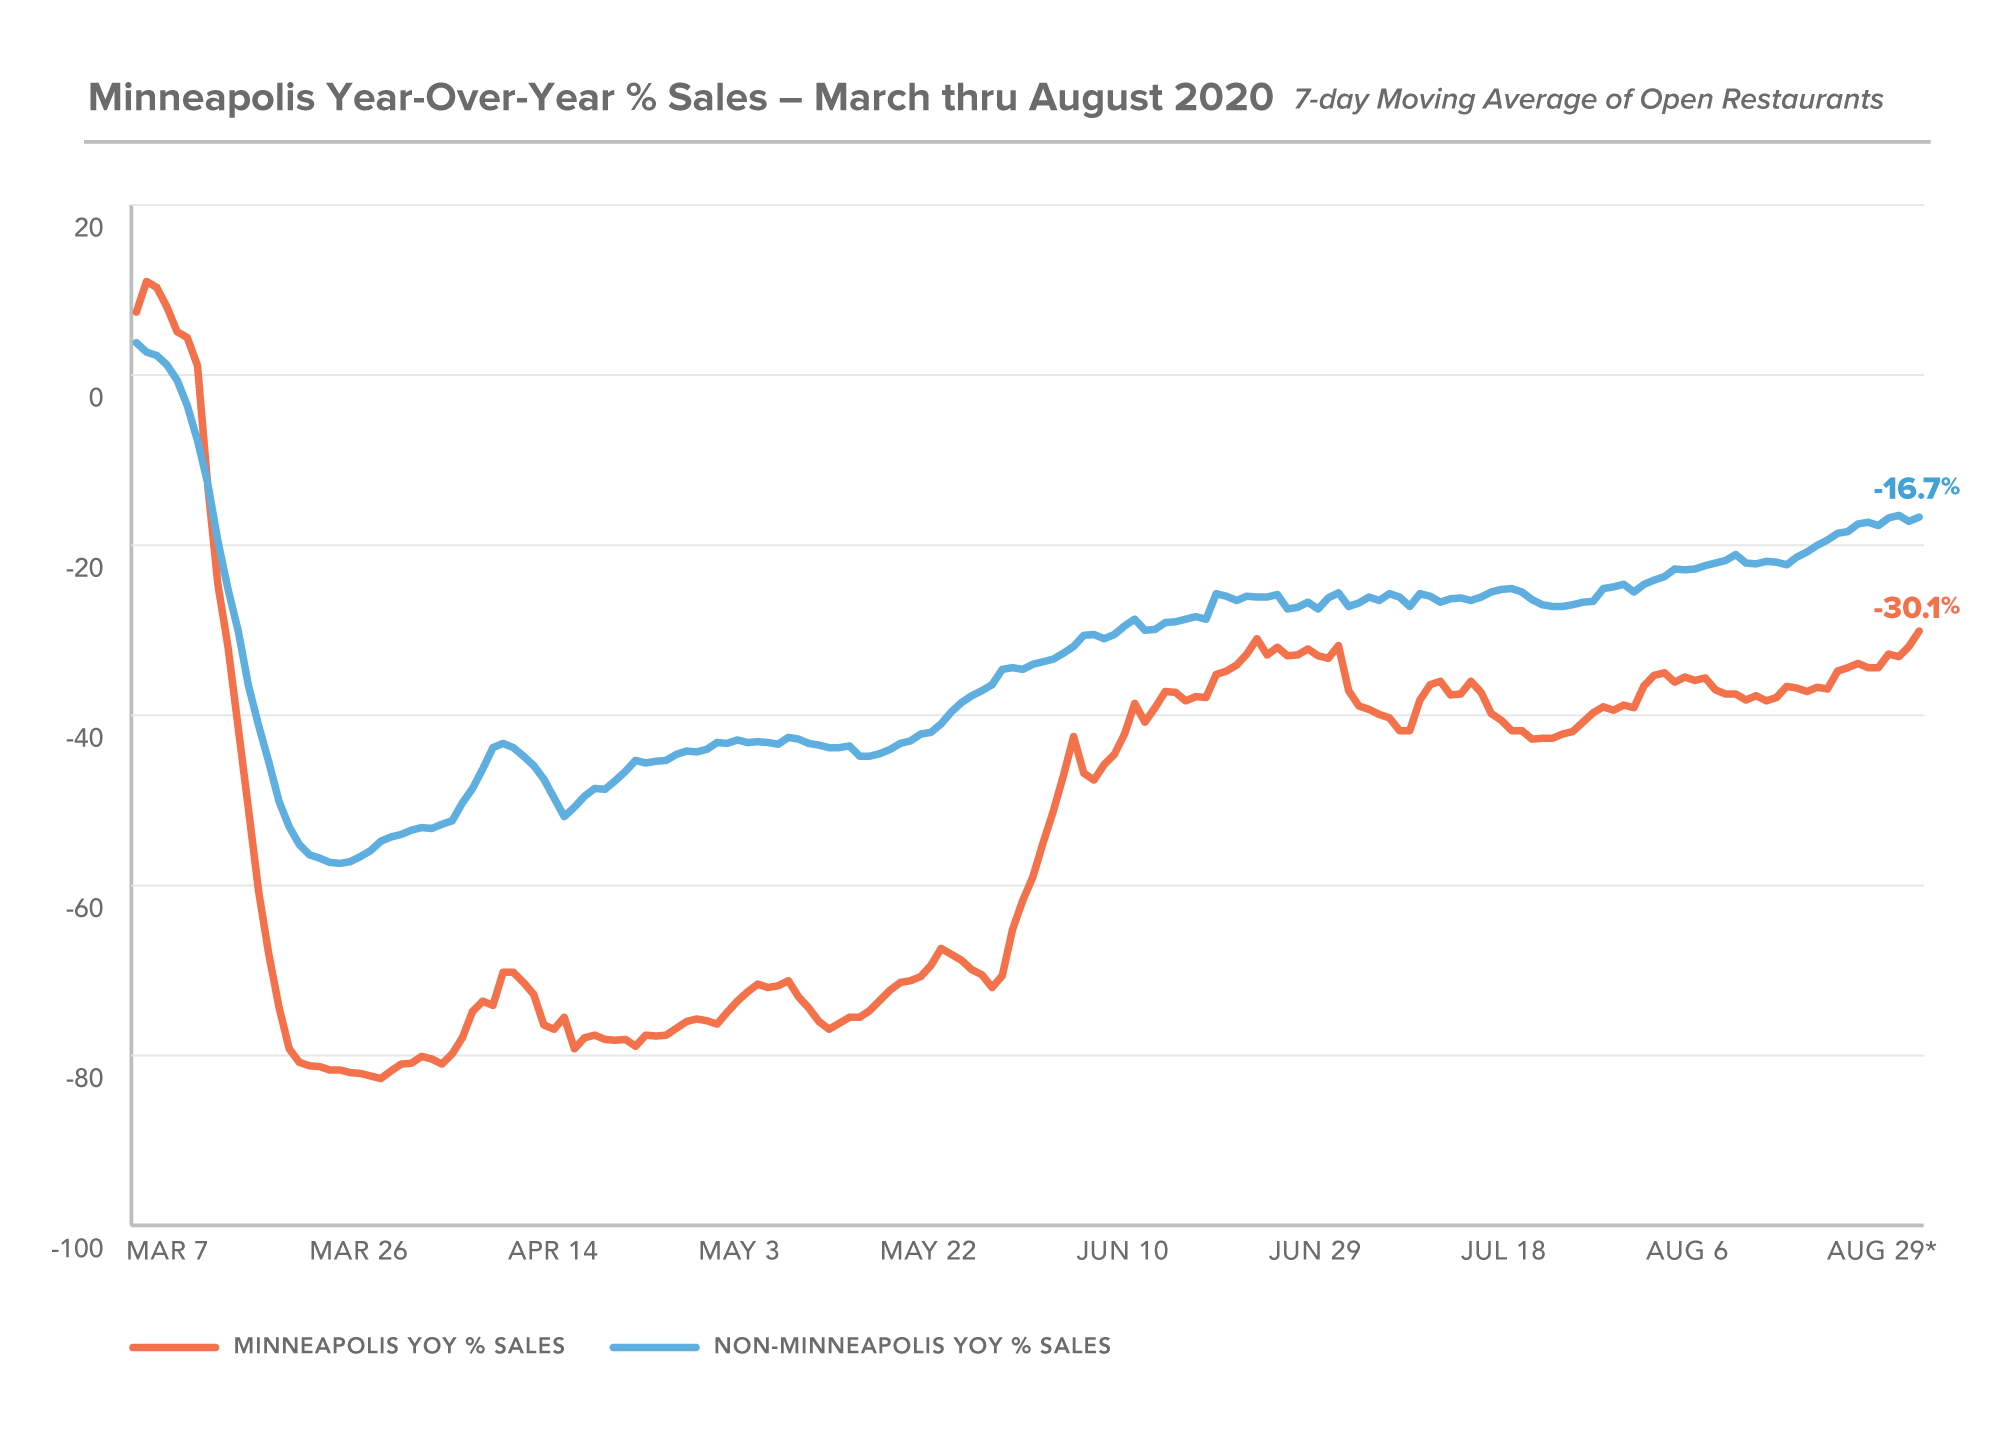
* We removed August 30 and 31 because last year those dates fell over Labor Day weekend, this year they did not, skewing the numbers too much to include in these graphs.
Email Updates
Sign up to receive our emails for sales data, updates and resources as our community navigates Covid-19.
SIGN UPAbout these metrics: The MarginEdge monthly snapshot of Minneapolis/St. Paul restaurant sales is based on a sampling of 100 area restaurants ranging from fast-casual to full-service.