
April 13, 2021
A strong month for area restaurants.
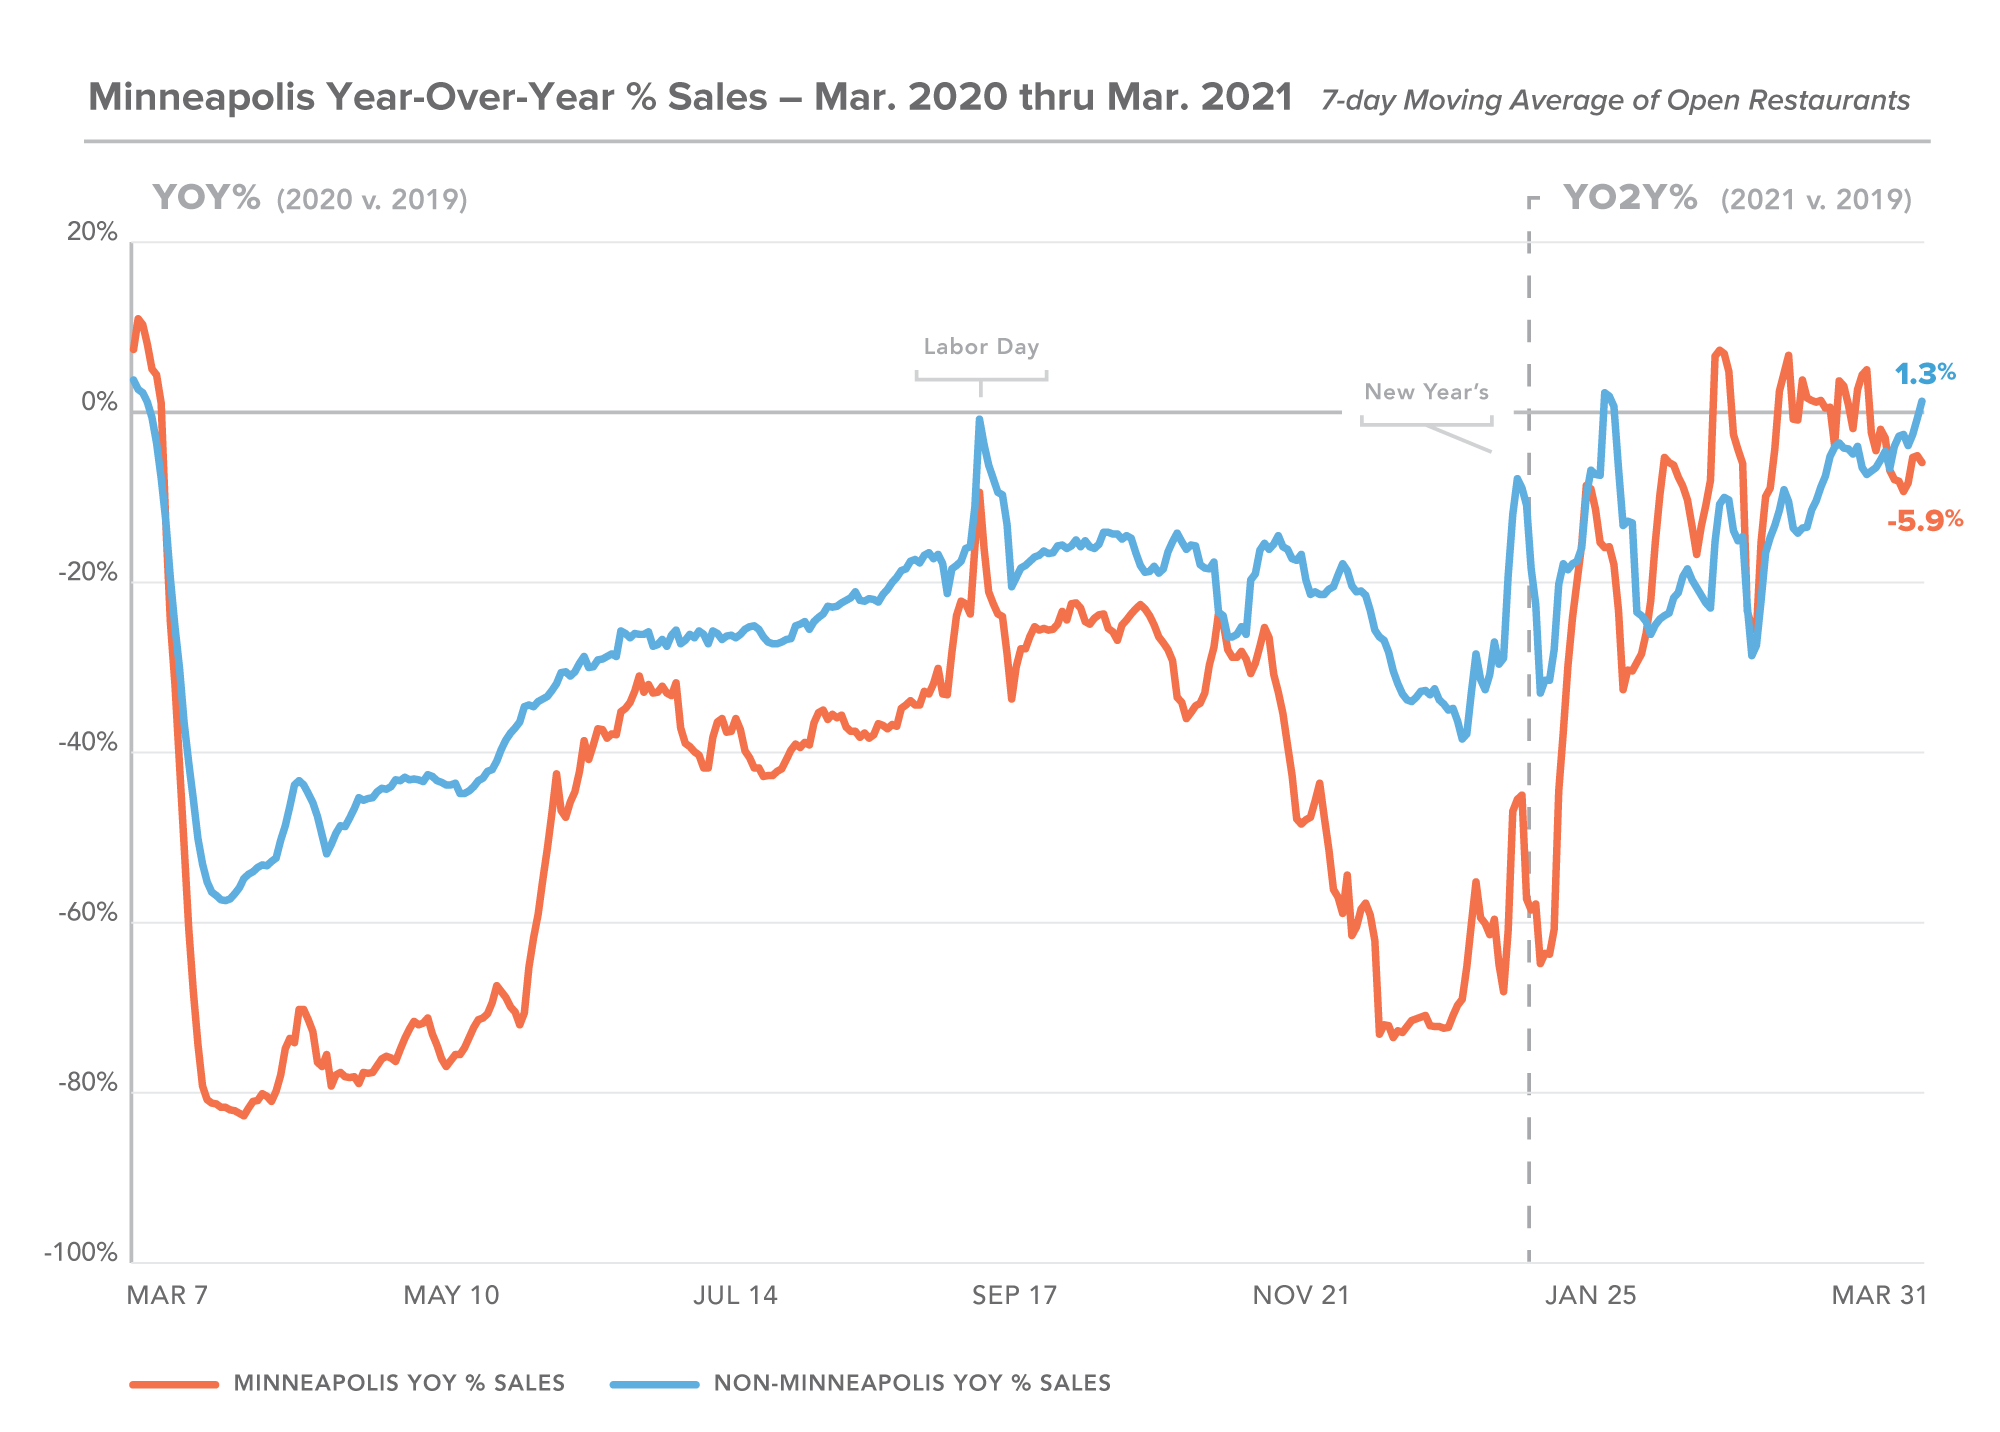
We’ve adjusted our view (as annotated in the graph) to start showing year-over-two-year numbers starting in January 2021. This comparison to our last “normal” year will hopefully be helpful in showing our recovery versus comparisons to 2020 numbers.
Minneapolis/St. Pauls has been crushing it! For a while, open restaurants in this area have even been beating non-Minneapolis sales numbers in our 2019 comparison. Twin Cities ended the month at -5.9% of 2019 sales for the last week of March. Sales have come such a long way from where we were a year ago and from December 2020.
Email Updates
Sign up to receive our emails for sales data, updates and resources as our community navigates Covid-19.
SIGN UPAbout these metrics: The MarginEdge monthly snapshot of Minneapolis/St. Paul restaurant sales is based on a sampling of 100 area restaurants ranging from fast-casual to full-service.