March 19, 2020
As I'm sure is true across our community, we are carefully watching every step on the local, state and federal level relief packages and working to aggregate any information here for easy access to resources. New information came out today and we are sifting through as a team. We hope to have takeaways for you first thing tomorrow.
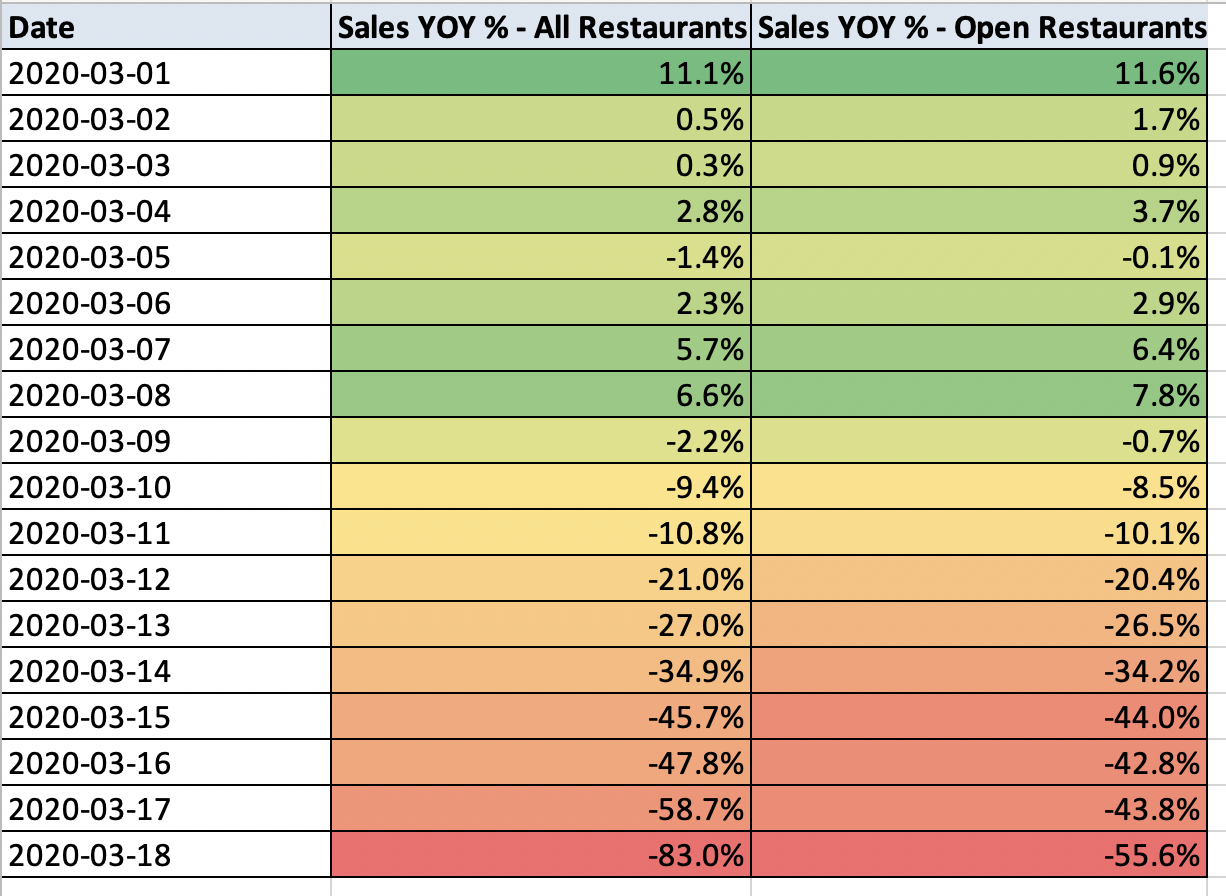
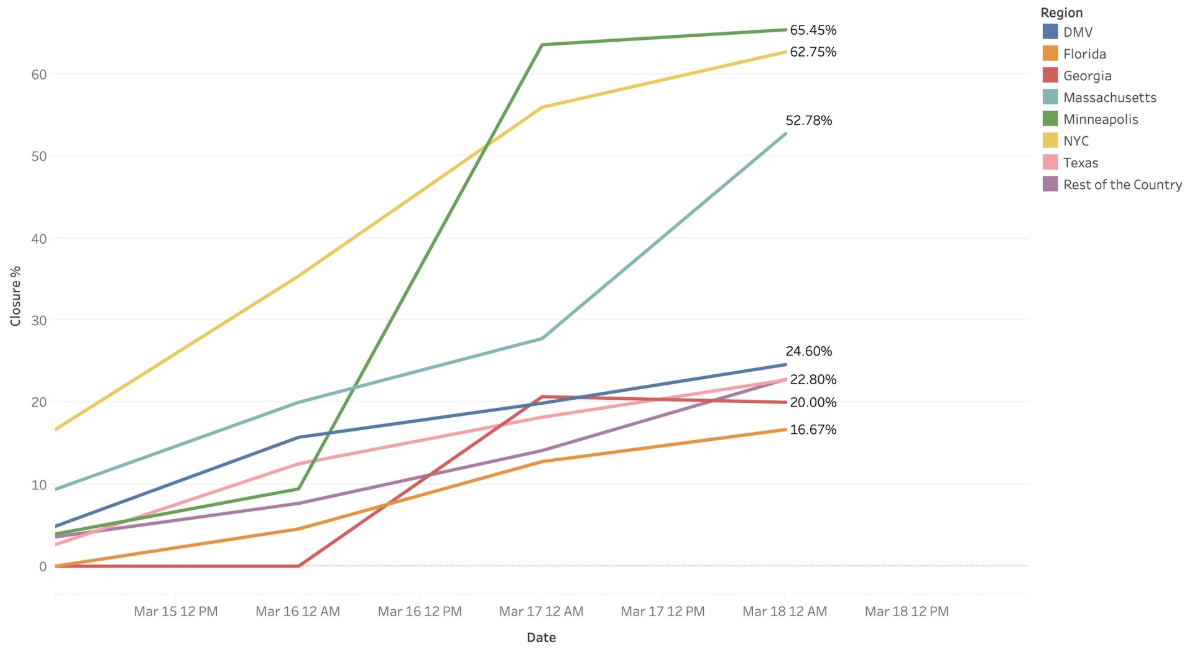
As our sample size continues to decrease as a result of voluntary and mandated closures and reduced operations for those still open, we changed our year-over-year view to show percentage change across all markets. We also included a view only showing percentage change for locations that were still operating in some capacity (shown side by side below). You can also see percentage of closures by market across our data set.
No doubt these numbers are not perfect given how data flows into our platform (estimating statistical significance around 10%) but want to prioritize speed to your inbox and directional data that hopefully helps you make informed decisions. We will continue to refine these views so if there is any particular piece of data you would like to see, let us know.
And as always, please pass this along if you know of anyone who wants to take advantage of our basic platform, offered free for the next few months as we weather this storm (and totally no obligation to continue). Hopefully we can help support managing business visibility on their end while also making our data set stronger.
Stay safe,
Bo