June 10, 2026
May 2026 national restaurant sales metrics are here!
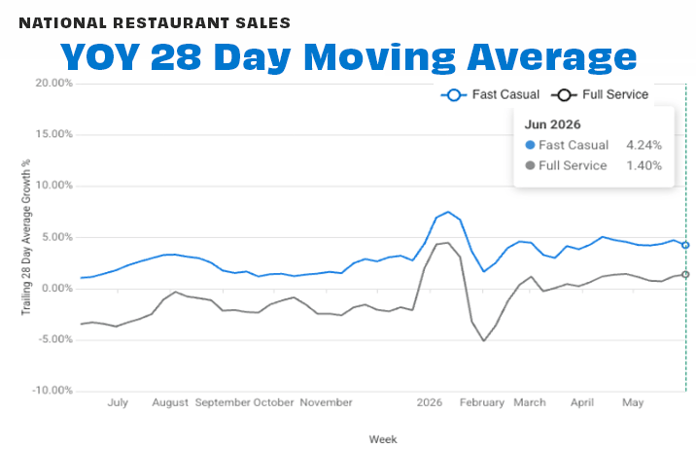
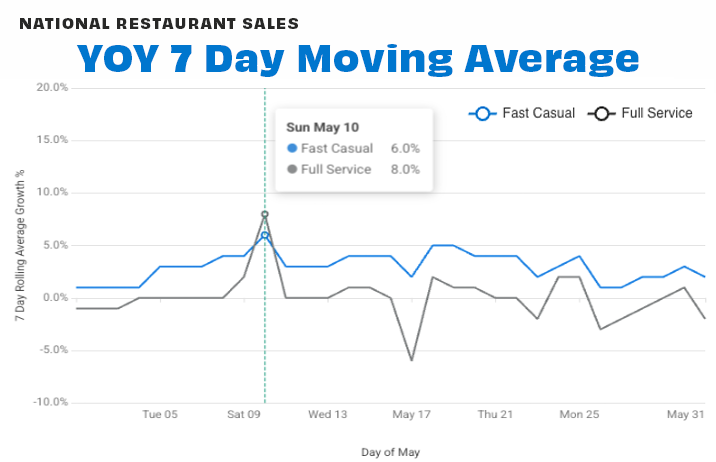
The trailing 4-week (28-day) average of year-over-year (YOY) sales for Fast Casual came in at +4.24% and Full Service at +1.40% at the end of May compared to 2025 sales.
Across the 7-day moving average chart, both segments saw positive growth during the first week of the month, peaking at +6% growth for Fast Casual and +8% growth for Full Service over Mother's Day weekend.
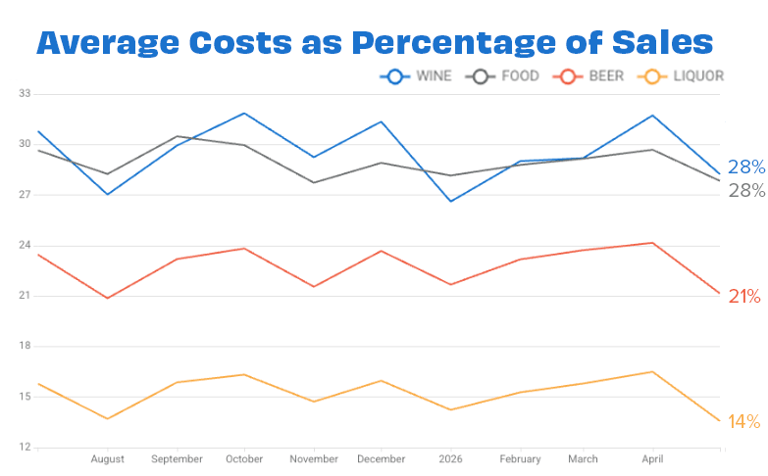
Food costs averaged 28% of sales last month, which was a slight drop from April.
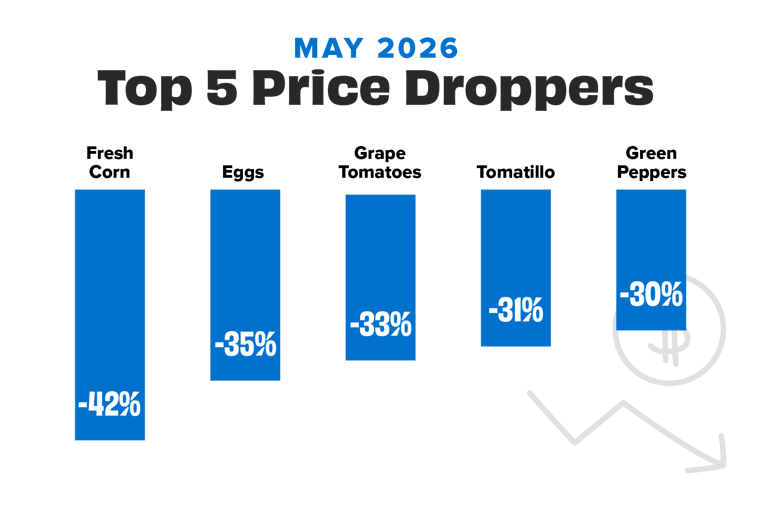
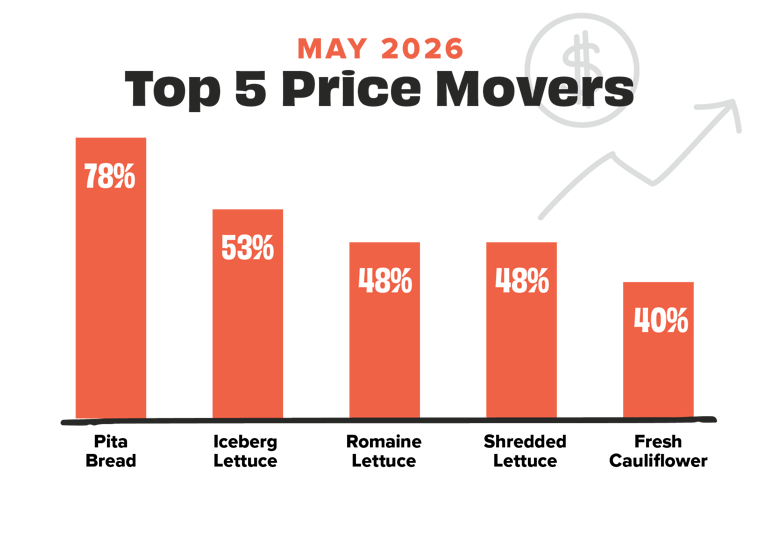
Pita bread did a 180˚ and topped our Movers list this month with prices +78% higher on average than in April, followed by iceberg lettuce, up +53%. On our Droppers chart, fresh corn prices came in with the biggest decrease at -42% lower than in April, followed by eggs (-35%) and grape tomatoes (-33%). After months of increase, it's great to see tomato prices coming back down again!
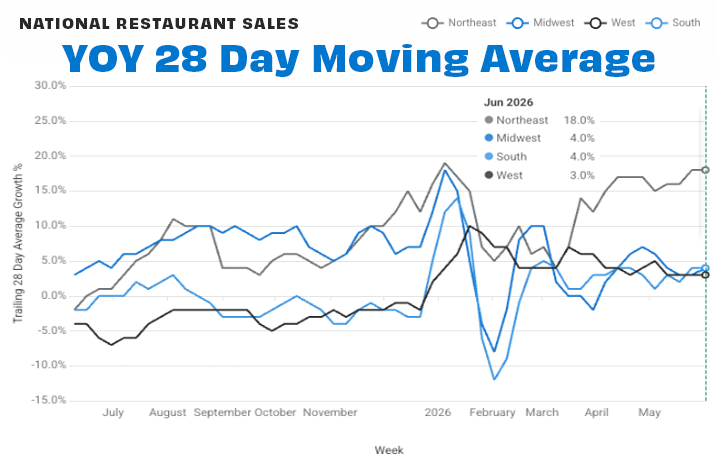
Regionally, the Northeast (once again) ended the month with the highest performance, at +18% growth.
See you in July!
![[Sign up for our newsletter] Get sales data and restaurant insights straight to your inbox each month](https://no-cache.hubspot.com/cta/default/6423873/2b19fcb4-92a7-41e5-8a2f-75a74dad0c24.png)