July 7, 2022
June's Monthly Metrics for the DMV are Here!
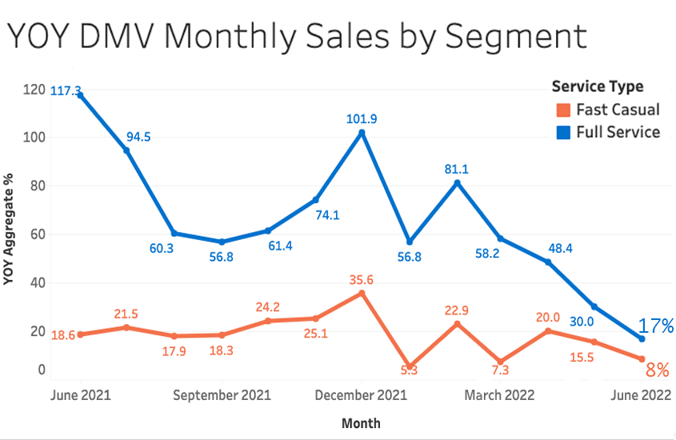
Year over year weighted monthly averages ended up at 17% for Full Service restaurants and 8% for Fast Casual restaurants in the DMV last month - which is great to see for overall sales - but we know that isn’t always the same as profitability. While we are happy sales continue to be up over last year we recognize that due to inflation, up may feel a little more flat.
![[Sign up for our newsletter] Get sales data and restaurant insights straight to your inbox each month](https://no-cache.hubspot.com/cta/default/6423873/2b19fcb4-92a7-41e5-8a2f-75a74dad0c24.png)
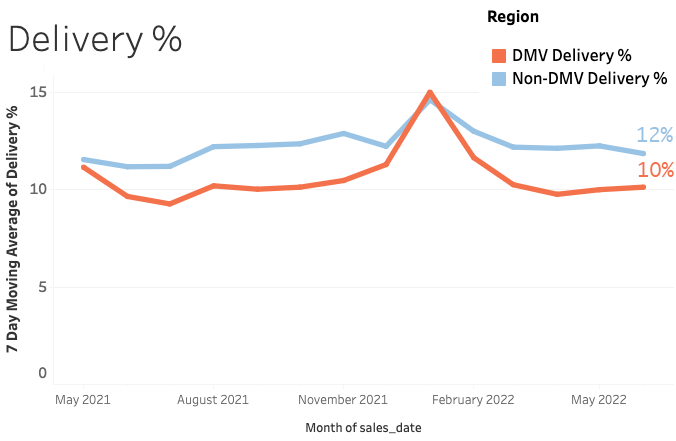
In-house delivery as a percentage of sales stayed nearly the same as May’s numbers, ending up at 10% for the DMV and 12% across the rest of the nation - great to see that diners are still venturing out, even in the summer heat.
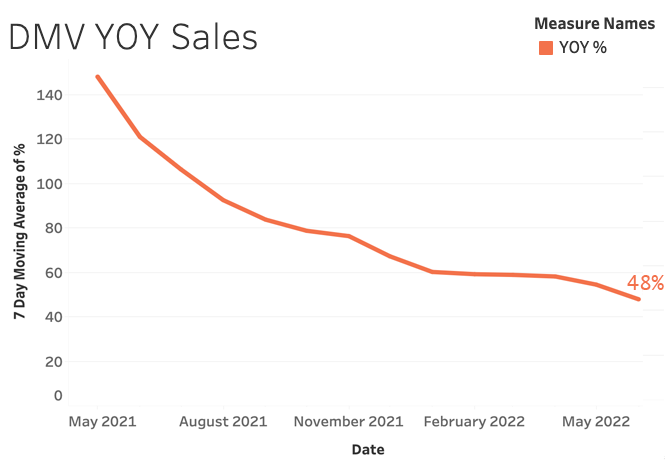
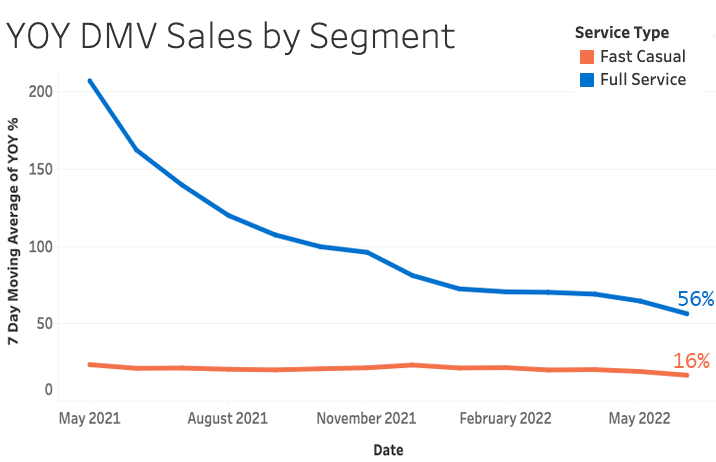
We saw overall sales end the month at 48% year over year, and by segment this is broken down with Full Service at 56% and Fast Casual at 16%.
For a little more context, the downward trend we're seeing is a natural transition down from the explosive boom in sales from 2021 compared to 2020 (which is the left side of the charts). So, while things may look a little rough at first glance, being 29% up in sales compared to last year is a fantastic metric- and one we don't want to downplay. As we get further into 2022, we should be able to see a clearer picture visually of how well sales are doing.
No doubt in a complex environment like we are in, these numbers may not tell the full story - and may create really different realities depending on the business. The great news is that numbers are holding steady even in the face of a challenging macro environment, and here’s hoping that July brings the significant upswing we have all been waiting for!