April 13, 2022
Sales, stats, and trends from thousands of restaurants
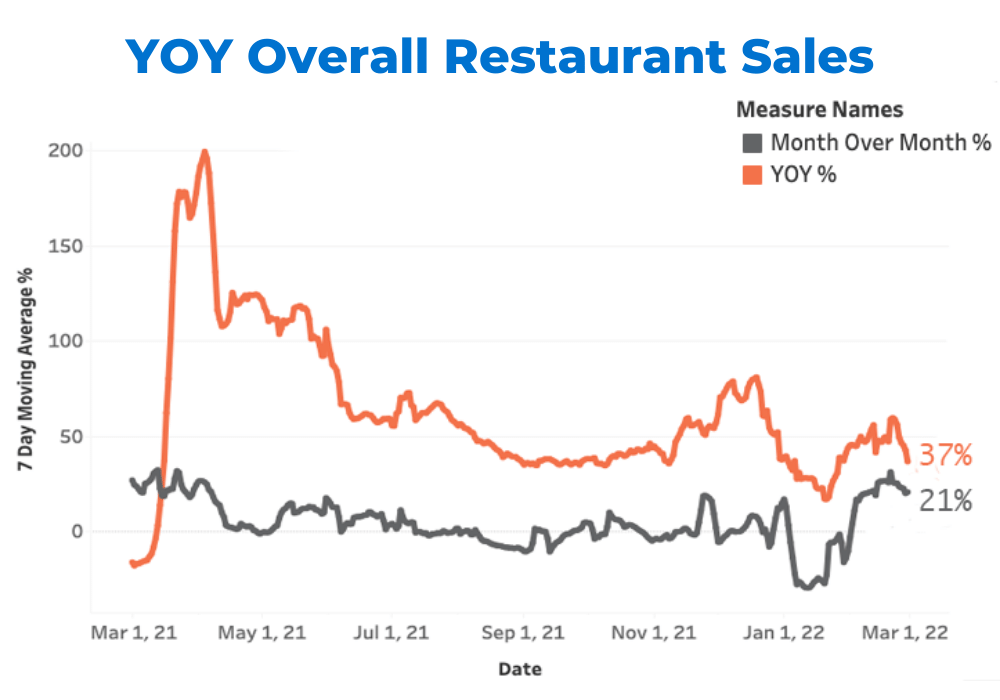
Greetings from 2022! We’re back with some really good news and a great start to the beginning of the year. February sales are looking fantastic and we are on track for even more greatness, bolstered by warmer weather on the way!
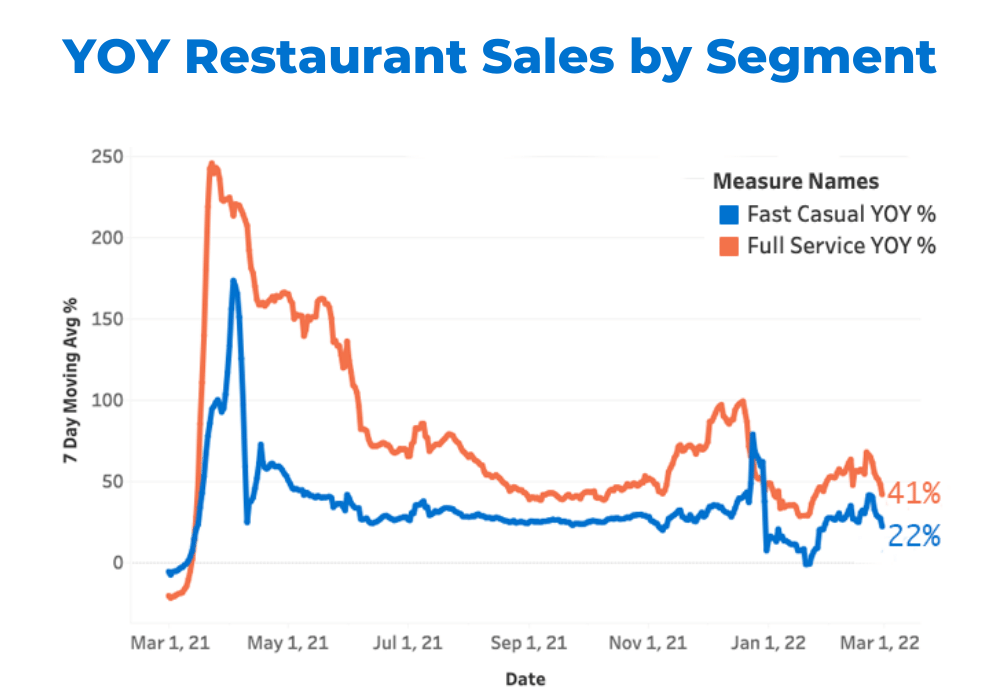
This update includes our new YOY view. In 2021, we compared sales numbers to 2019 because that was the last “normal” year. It makes sense now to return to year over year because, although 2021 had its fair share of ups and downs, it’s likely our new “normal”.
Going back to YOY also does a better job of addressing the increased inflation in sales numbers as we all recognize that everything has gotten drastically more expensive since 2019, including menu prices.
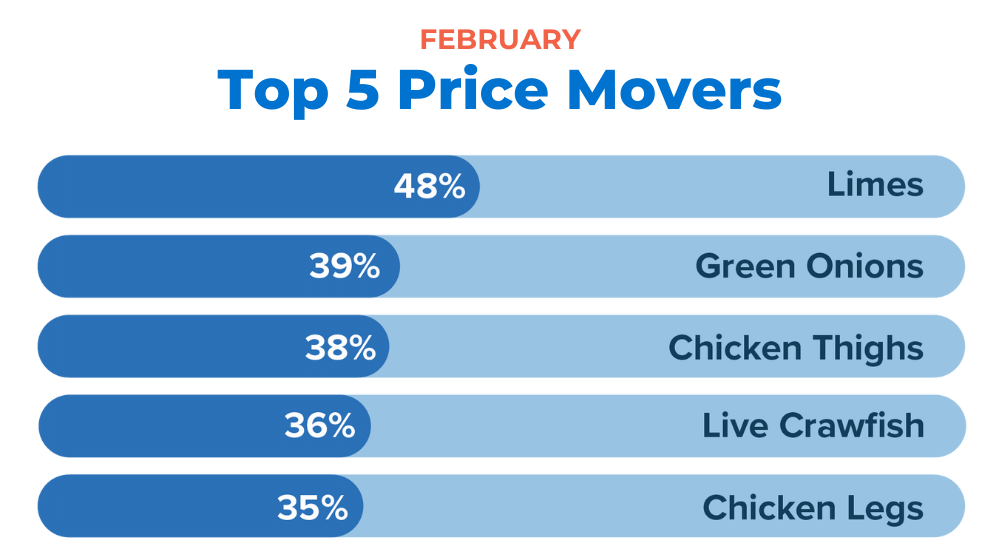
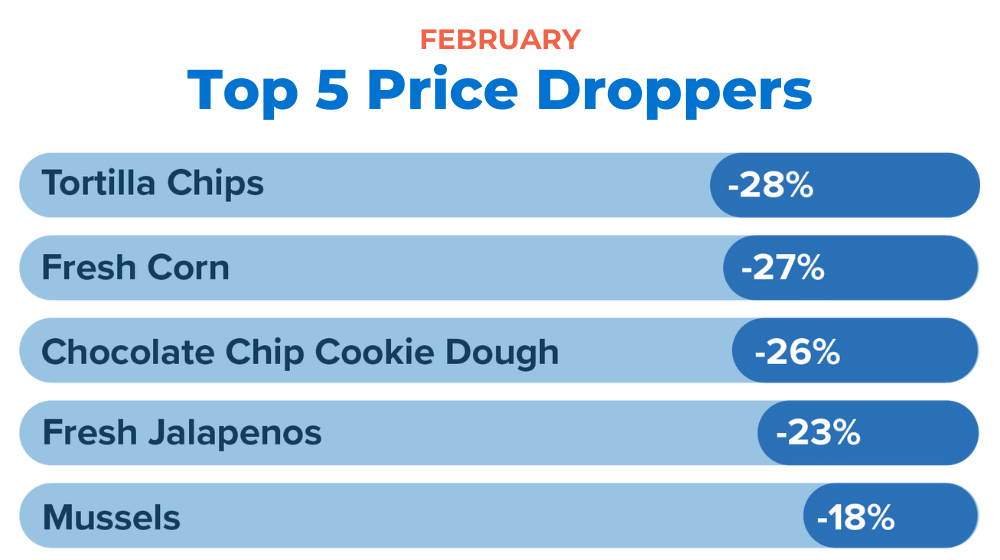
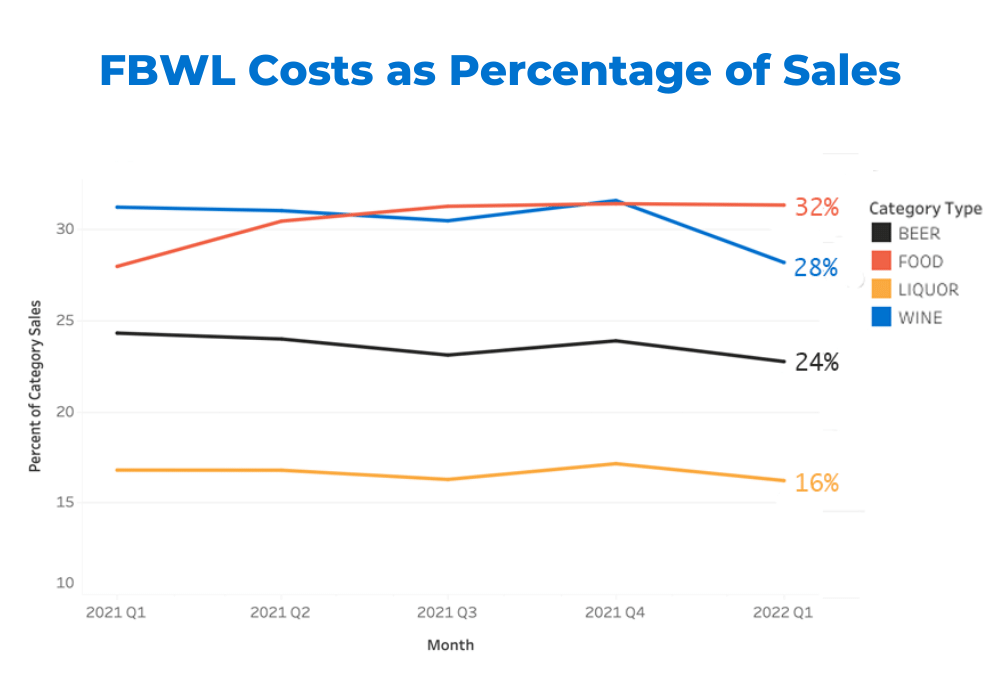
Along with our price movers and droppers, we have a new chart to share: food, beer, wine and liquor costs broken down by percentage nationally.
We hope you all continue to stay safe and wish everyone a successful spring!
Best,
Bo
![[Sign up for our newsletter] Get sales data and restaurant insights straight to your inbox each month](https://no-cache.hubspot.com/cta/default/6423873/2b19fcb4-92a7-41e5-8a2f-75a74dad0c24.png)