
April 12, 2021
Wonderful Start to Spring
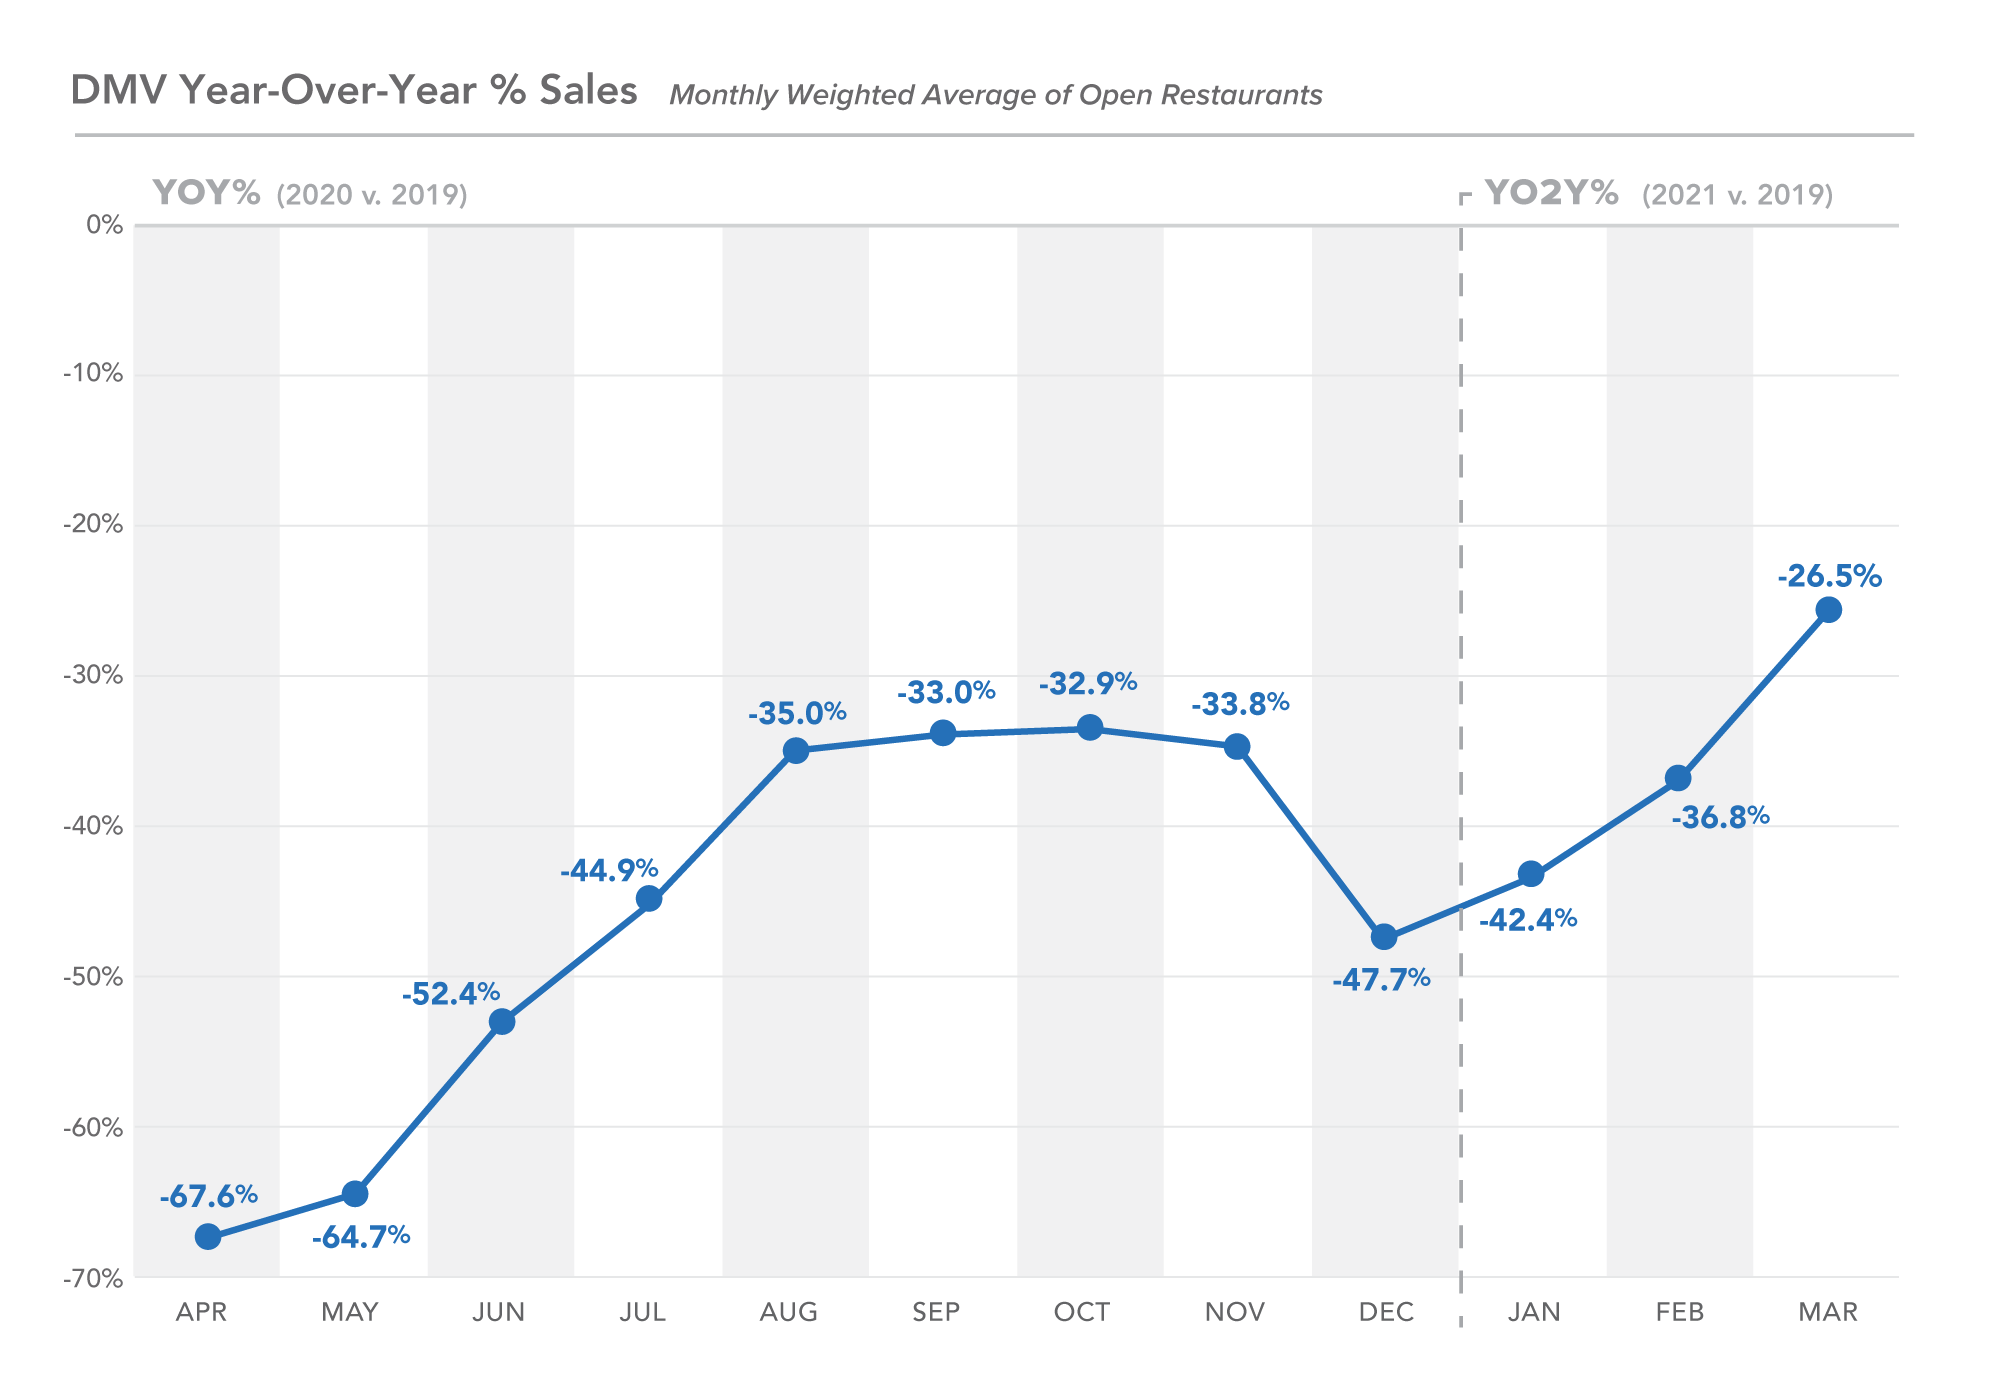
We’ve adjusted our view (as annotated in the graph) to start showing year-over-two-year numbers starting in January 2021. This comparison to our last “normal” year will hopefully be helpful in showing our recovery versus comparisons to 2020 numbers.
In March, DC hit the highest mark in over a year, reaching -26.5% in monthly weighted average restaurant sales as compared to March 2019. With still a lot of ground to cover, this trend line continues to show the momentum created by a month of beautiful spring weather, a vaccine campaign starting to gain traction and increased re-openings after winter closures.
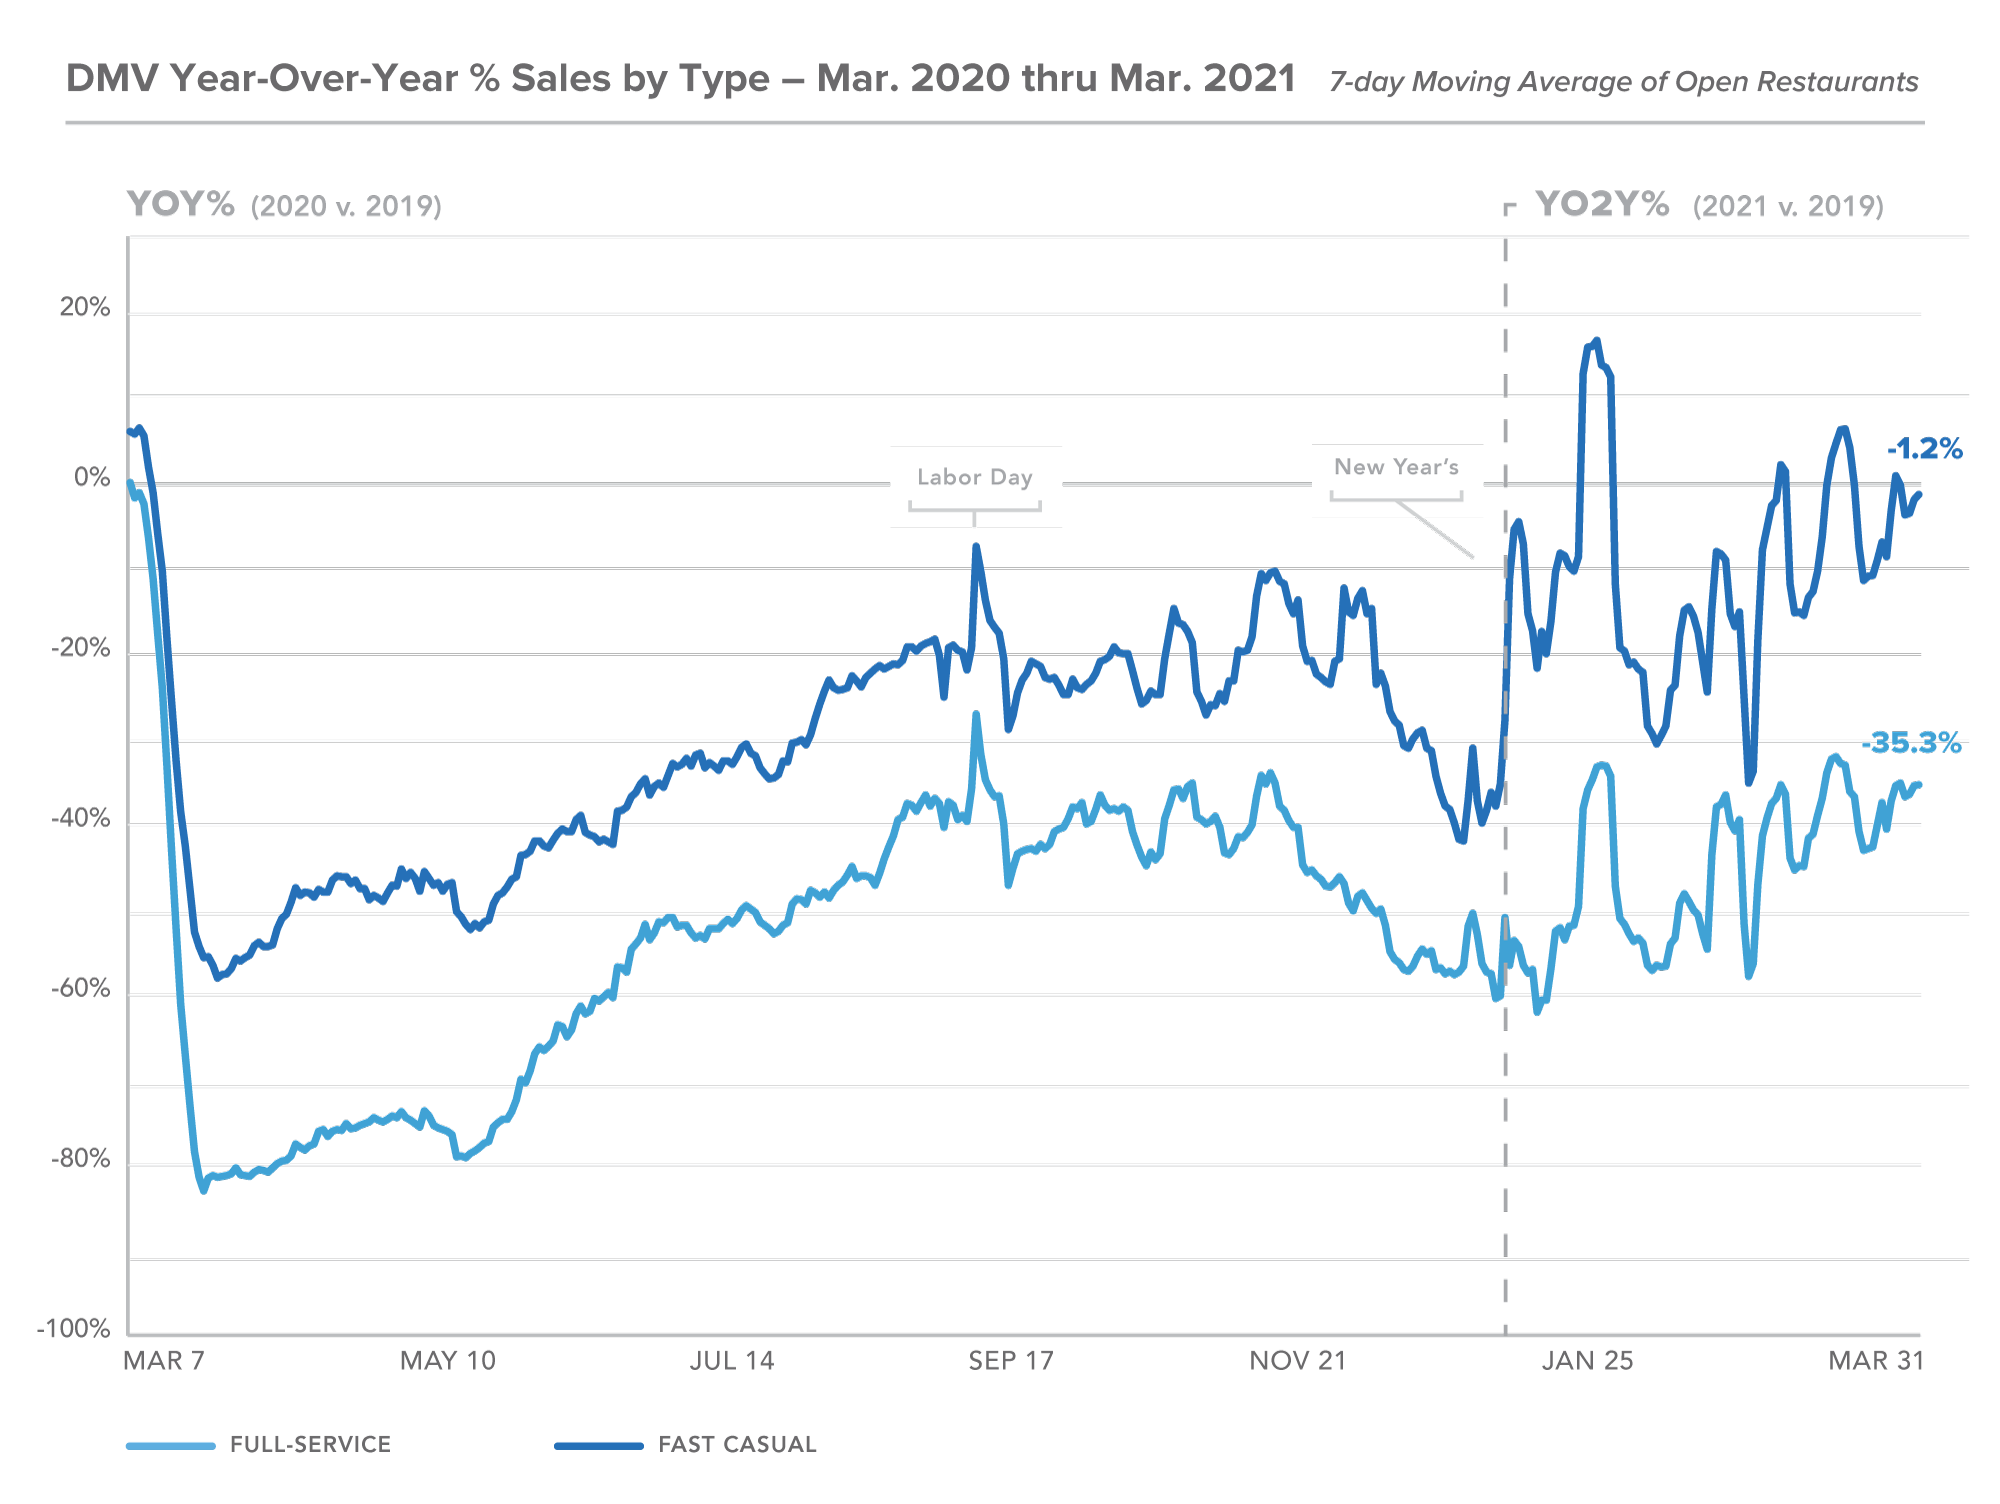
The growth in year-over-two-year sales is driven primarily by the rapid recovery of Fast Casual at almost break even with 2019, with the Full Service segment lagging behind at -35.3% year-over-two-year. This gap in recovery is likely driven by continued restrictions to indoor dining and continued hesitancy from customers returning to “normal dining” in full force.
Our expectation is that with the increasing vaccination efforts combined with the continued relaxation of restrictions that we start to see Full Service close the gap over the next few months.
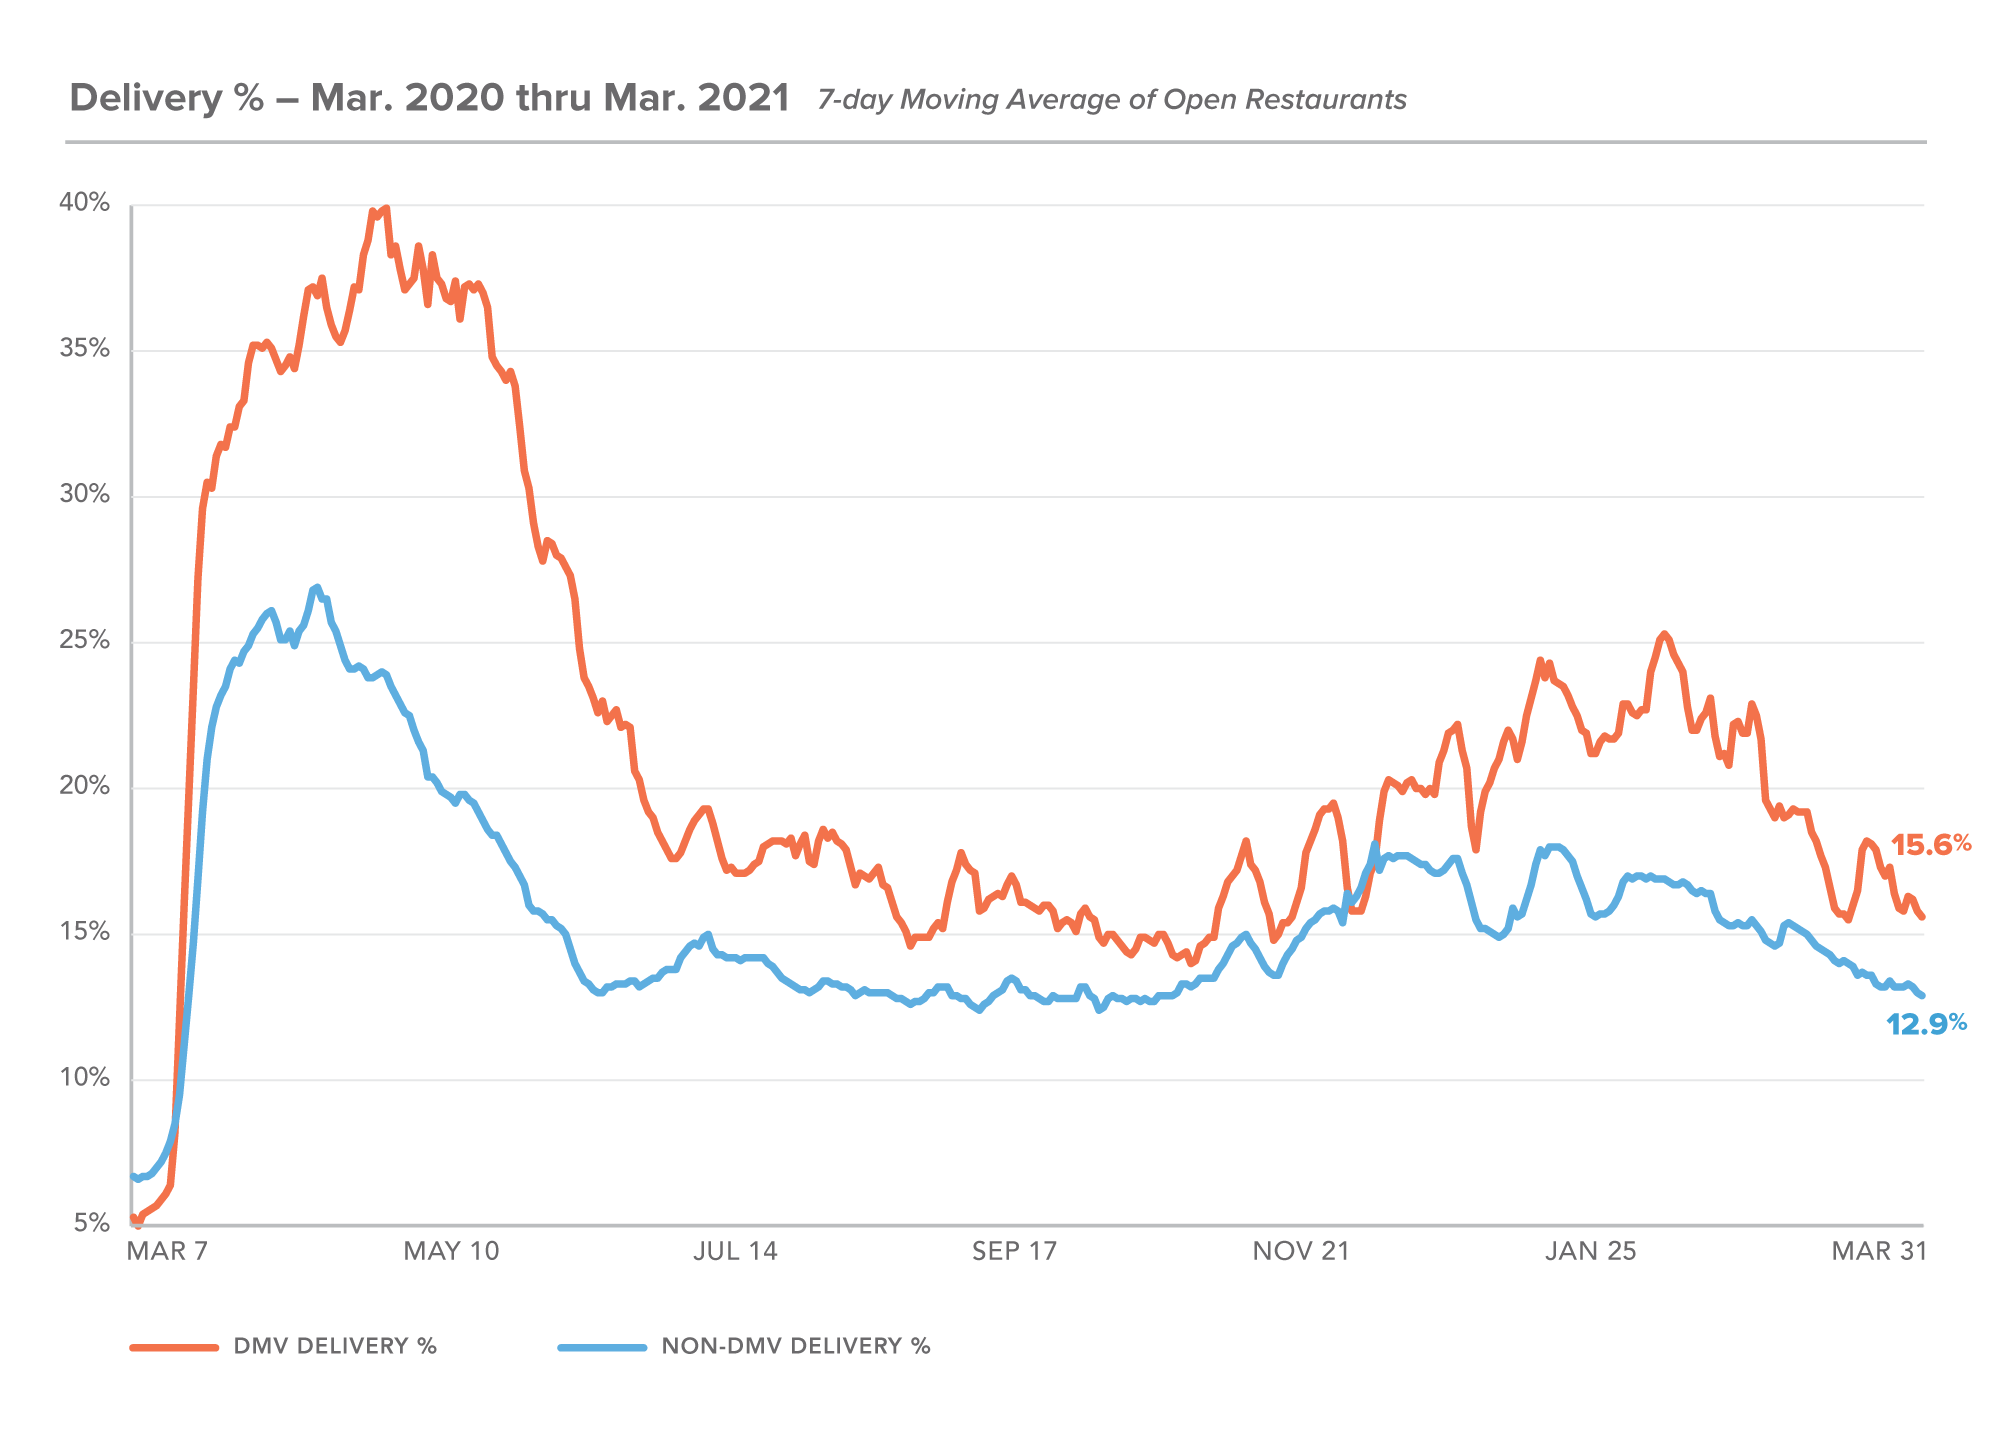
Beautiful weather in March is likely the primary driver in the decreased dependence on third-party delivery, with customers more likely to dine outdoors or walk to pick up their food from local restaurants.
Food Costs
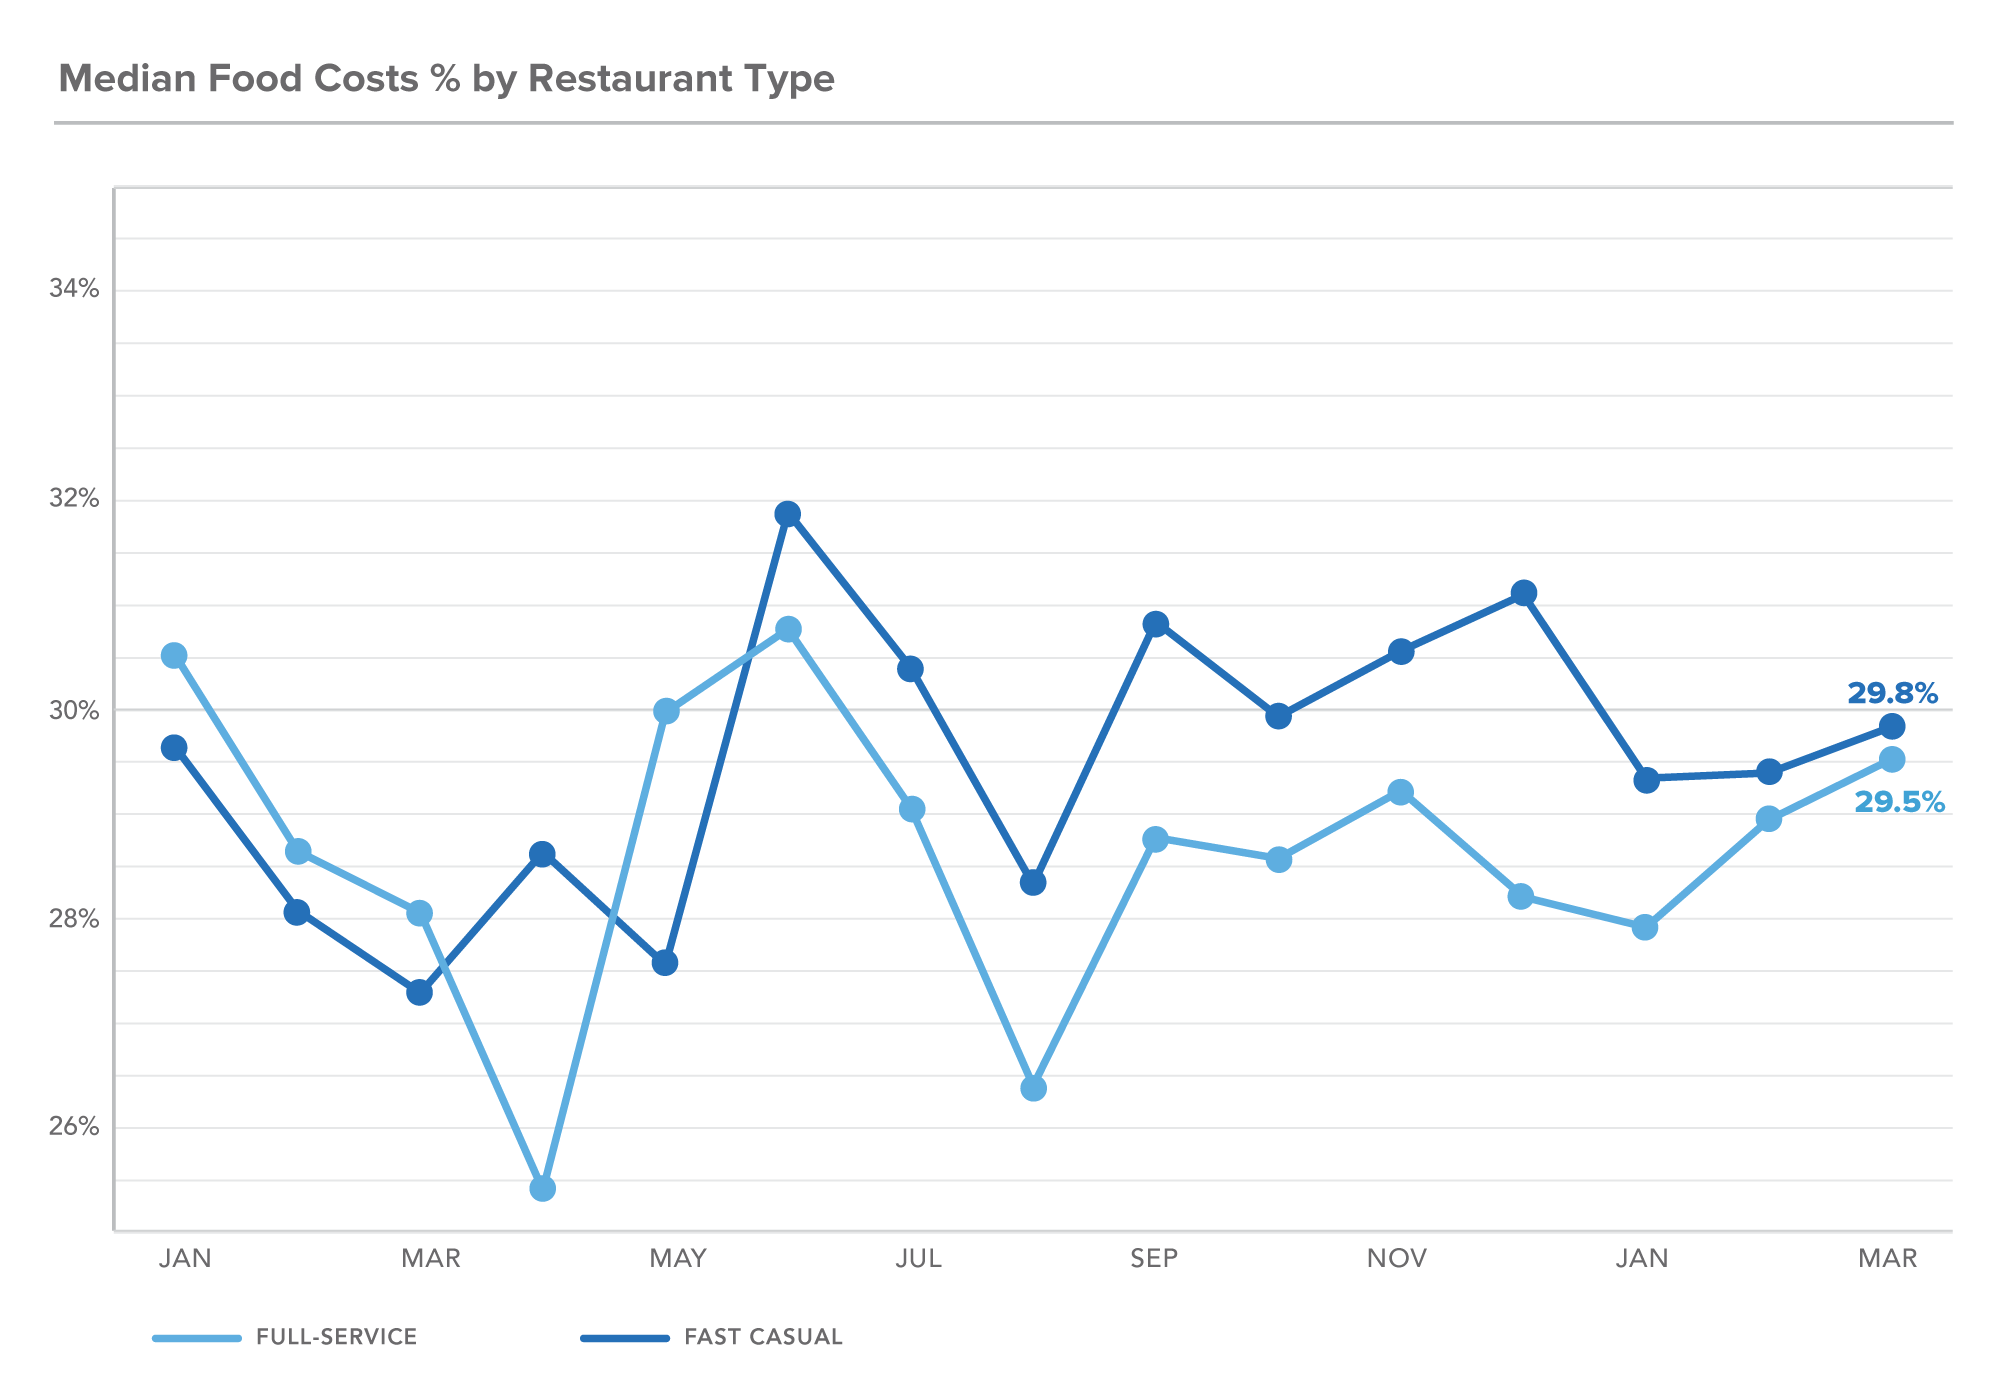
In addition to reporting on top-line health for restaurants, we wanted to show something that is more representative of profitability. Food costs are a major variable cost for restaurants and the ability to keep it this cost line with sales can make or break a restaurant. Here are median food costs as a percentage of sales for restaurants since January 2020, split between fast-casual and full-service restaurants.
There were lots of storylines throughout the pandemic on interrupted supply chain and food pricing variability, not to mention top-line volatility, but what this shows is that restaurants were able to be nimble enough to keep their food costs relatively stable even in a highly unpredictable environment. Just another example of the creativity and nimbleness of restaurants who pivoted menus, business models and team structures to keep these costs in line.
About these metrics: The MarginEdge monthly snapshot of DC Metro restaurant sales is based on a sampling of 300+ area restaurants ranging from fast-casual to full-service.
Tag(s):
Metrics