
July 7, 2020
We’ve got a couple of new views for you today!
With so much changing across the country, our phased reopening views were getting a little hard to decipher and hard to track on our side. We are finding the reopening path isn’t always a linear journey with a lot of variance market-by-market – so we decided to try a new view on for size.
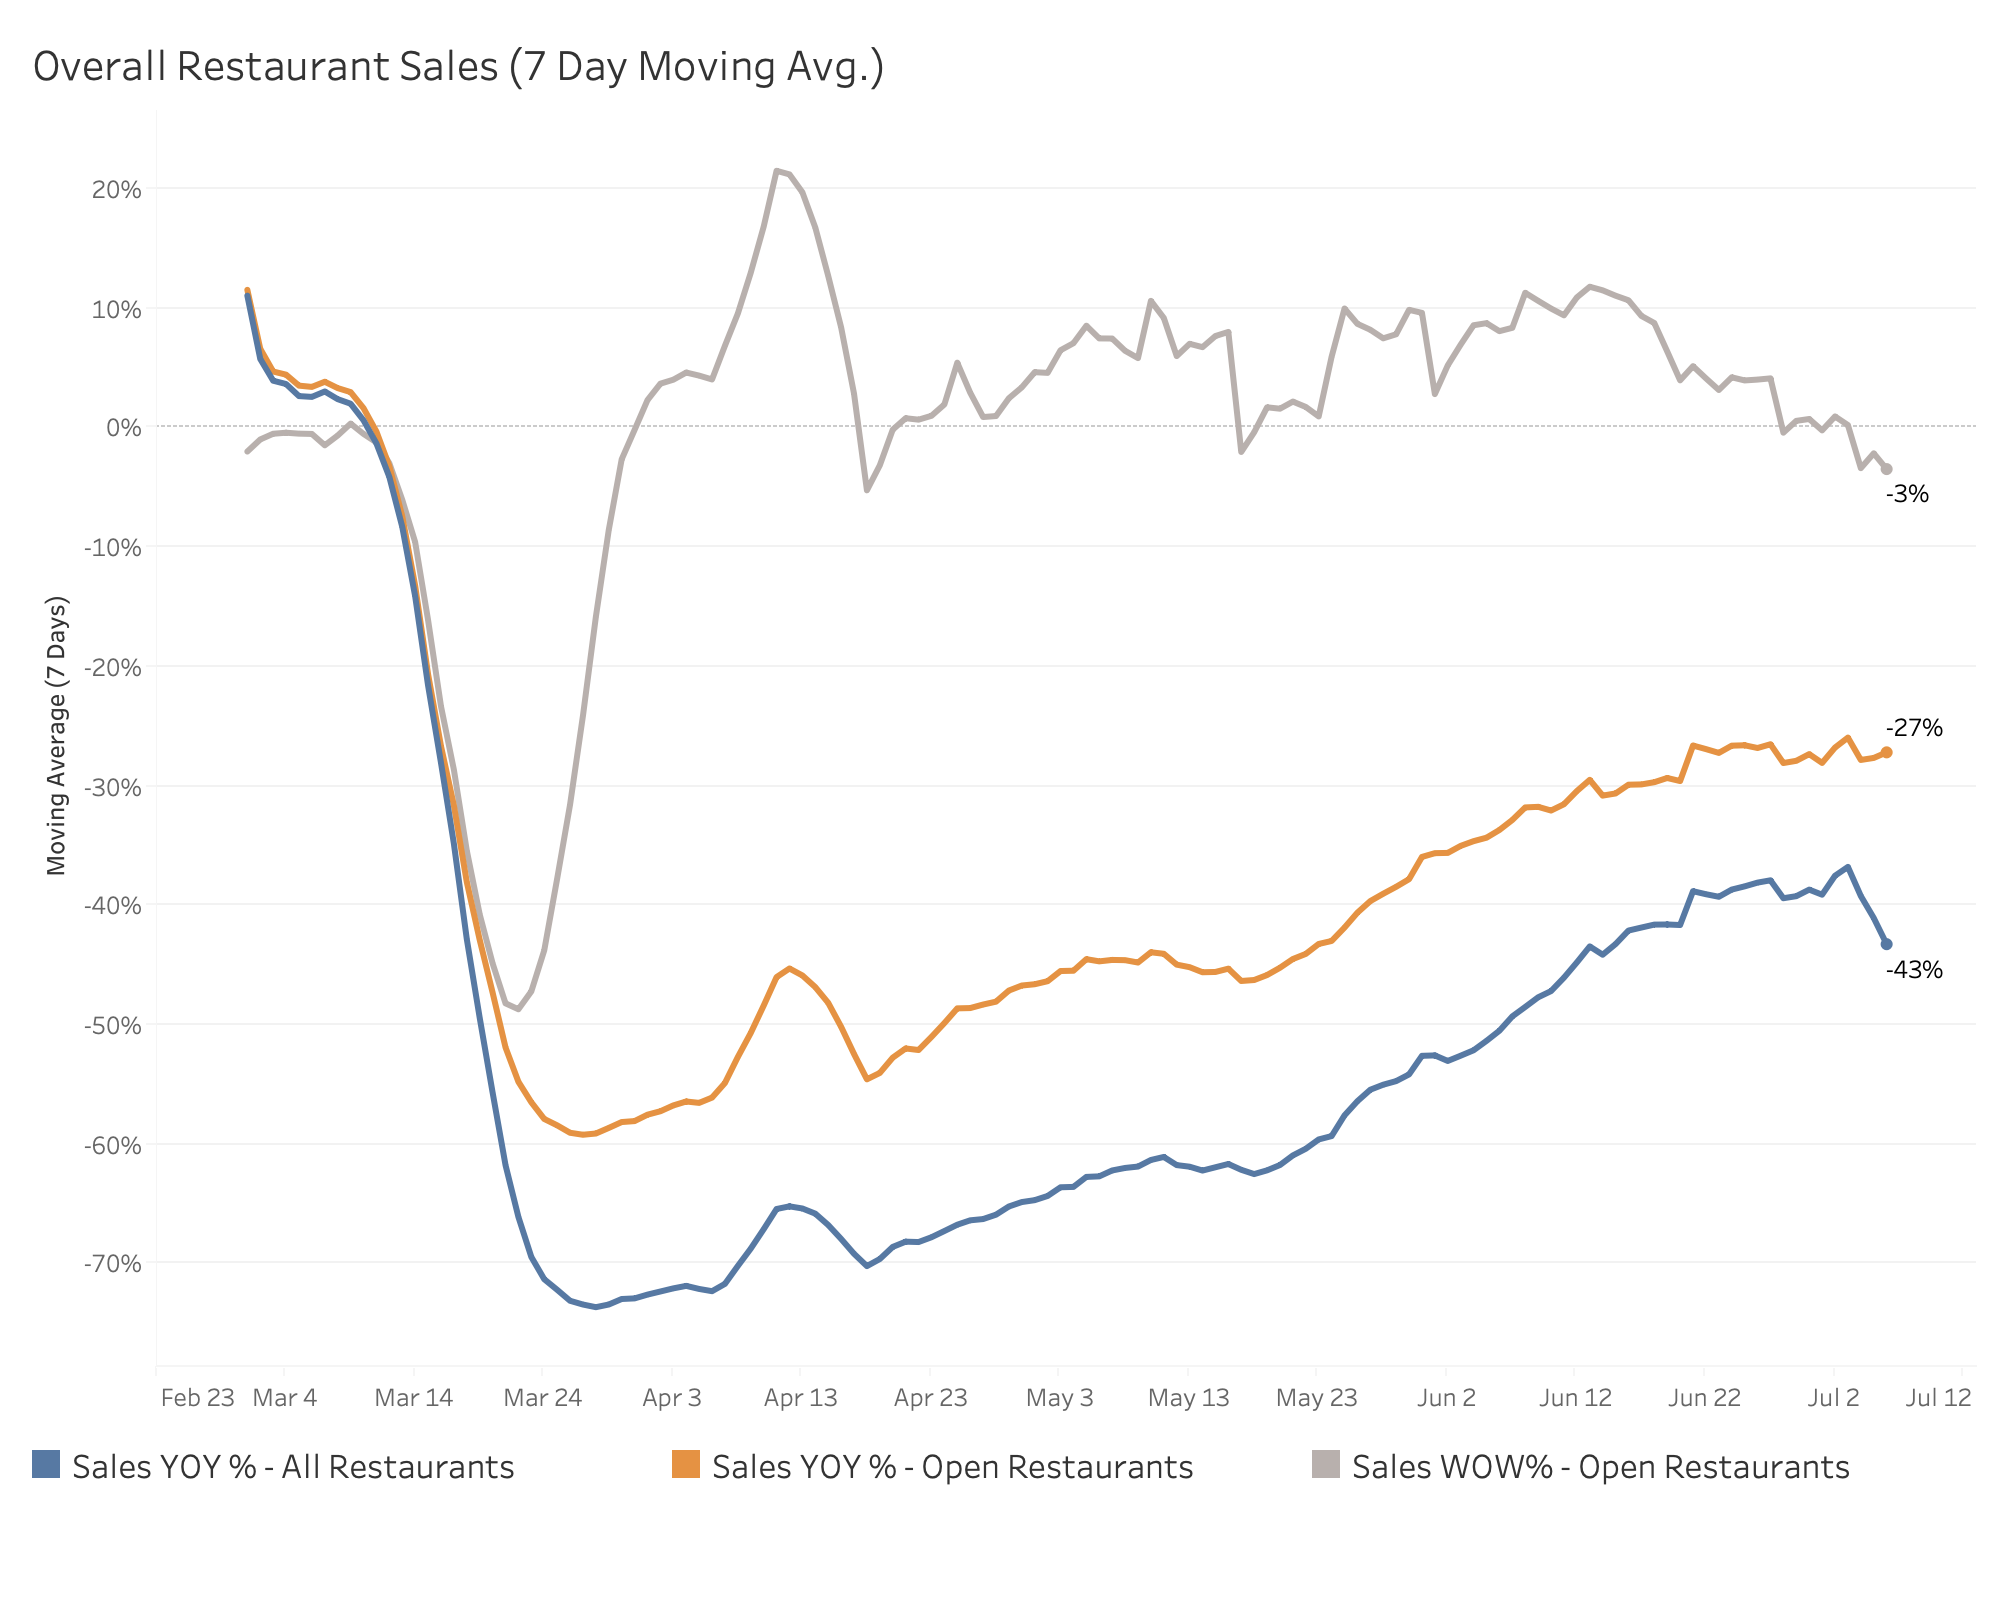
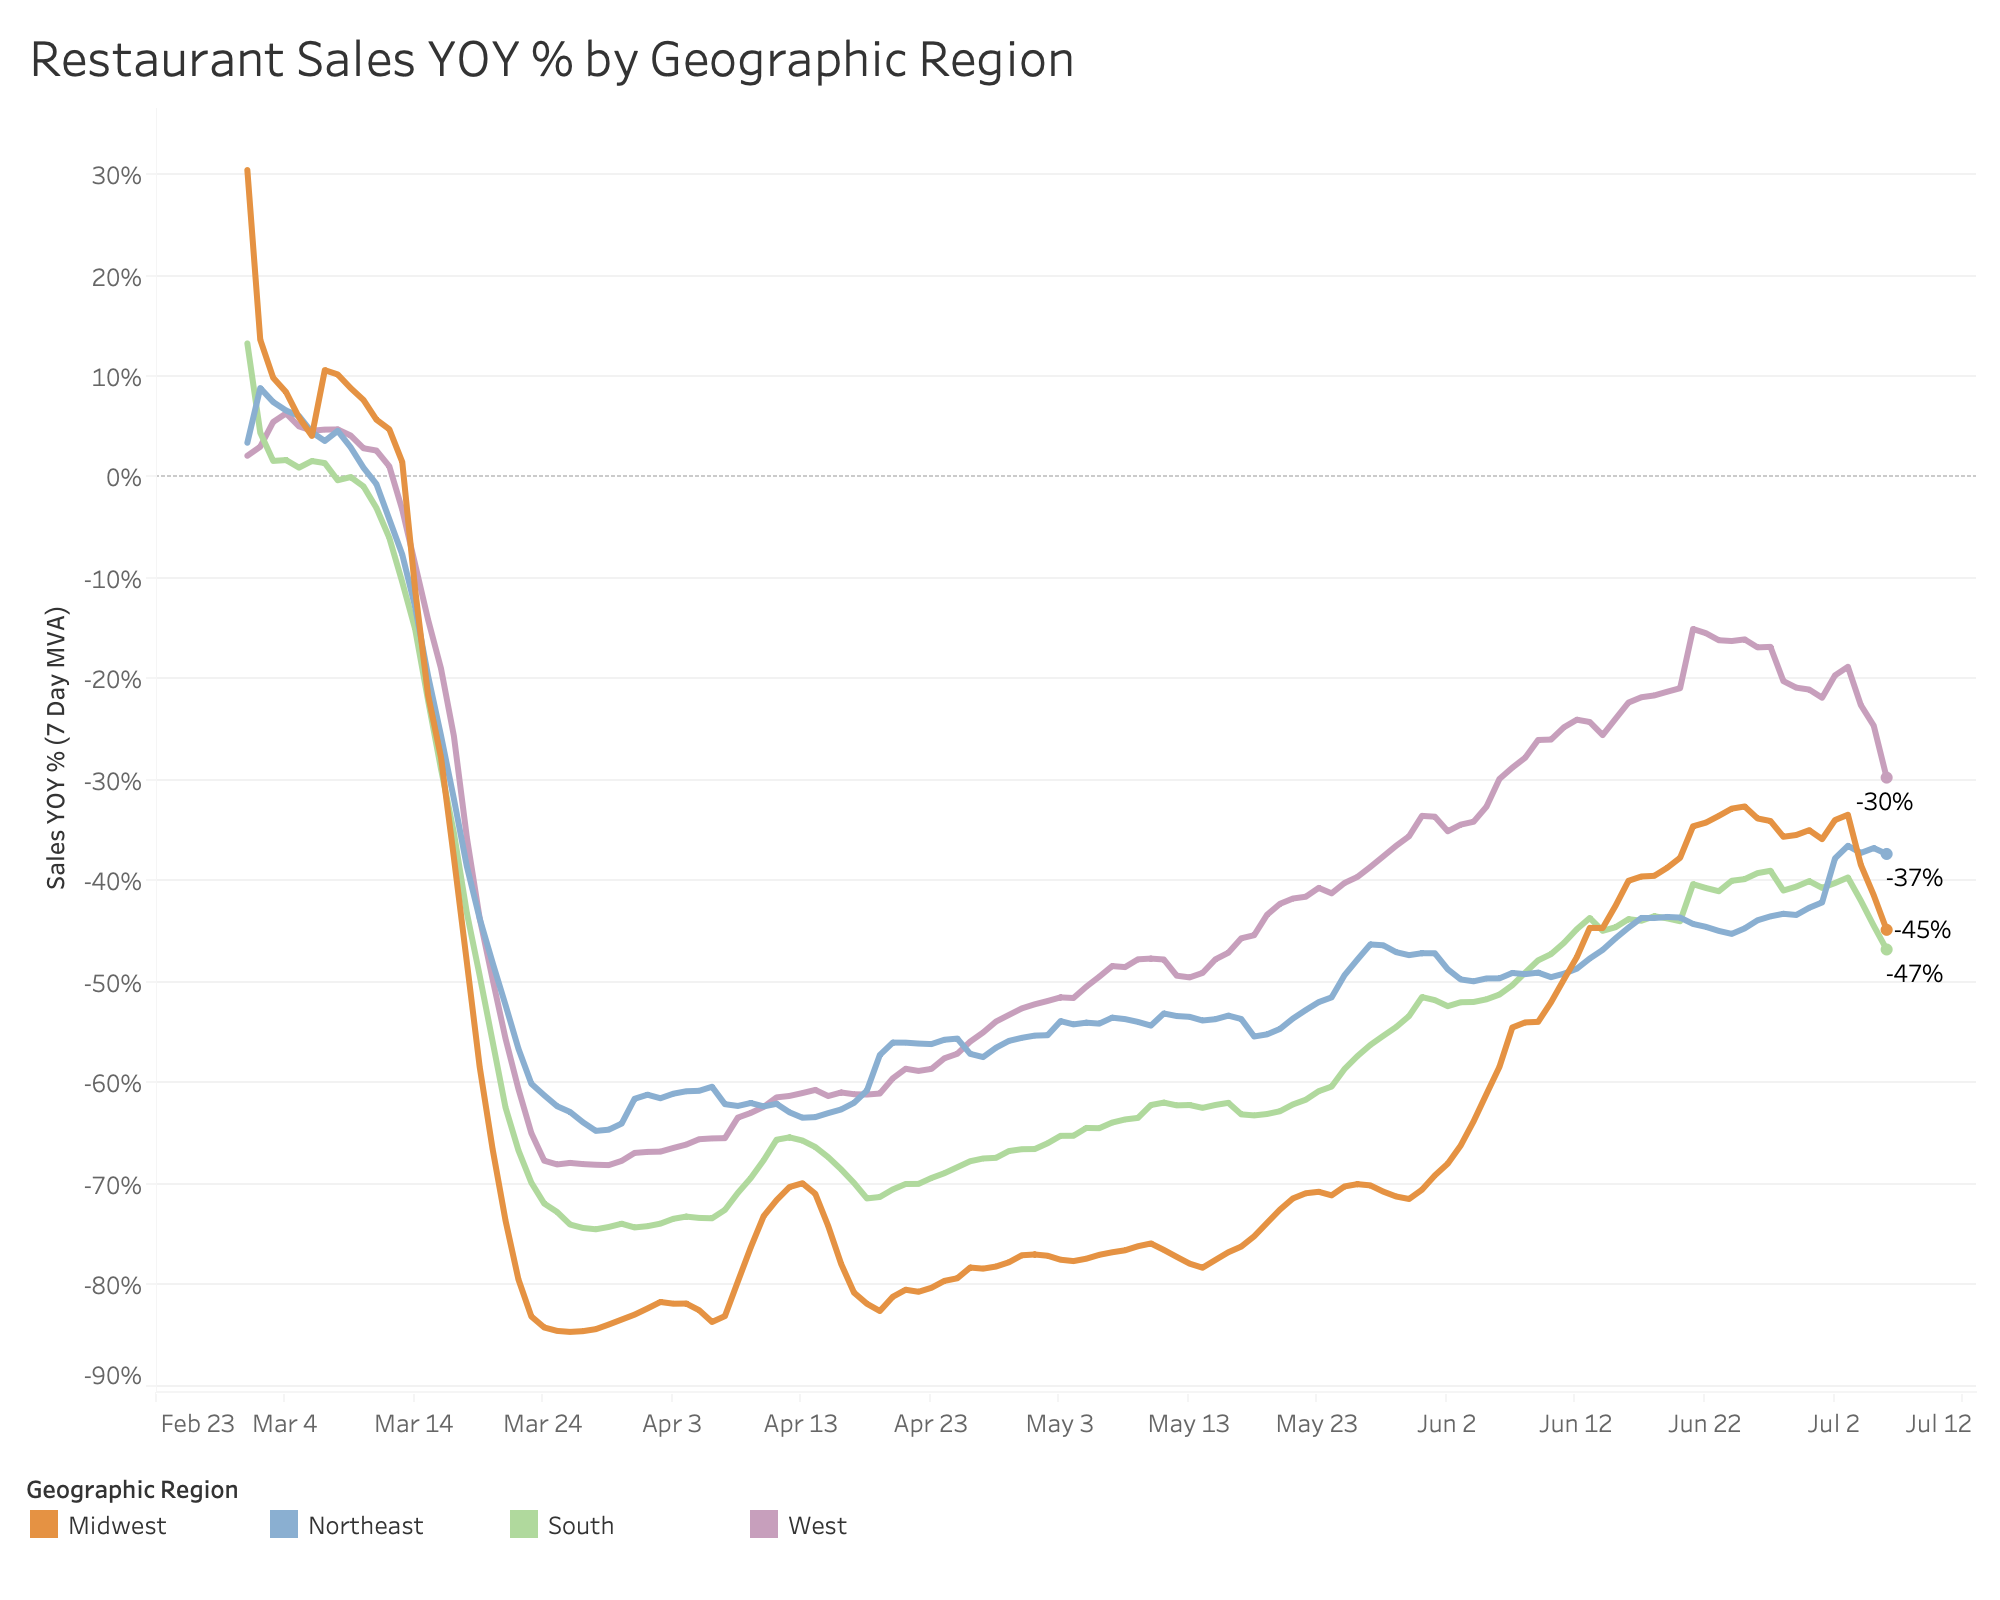
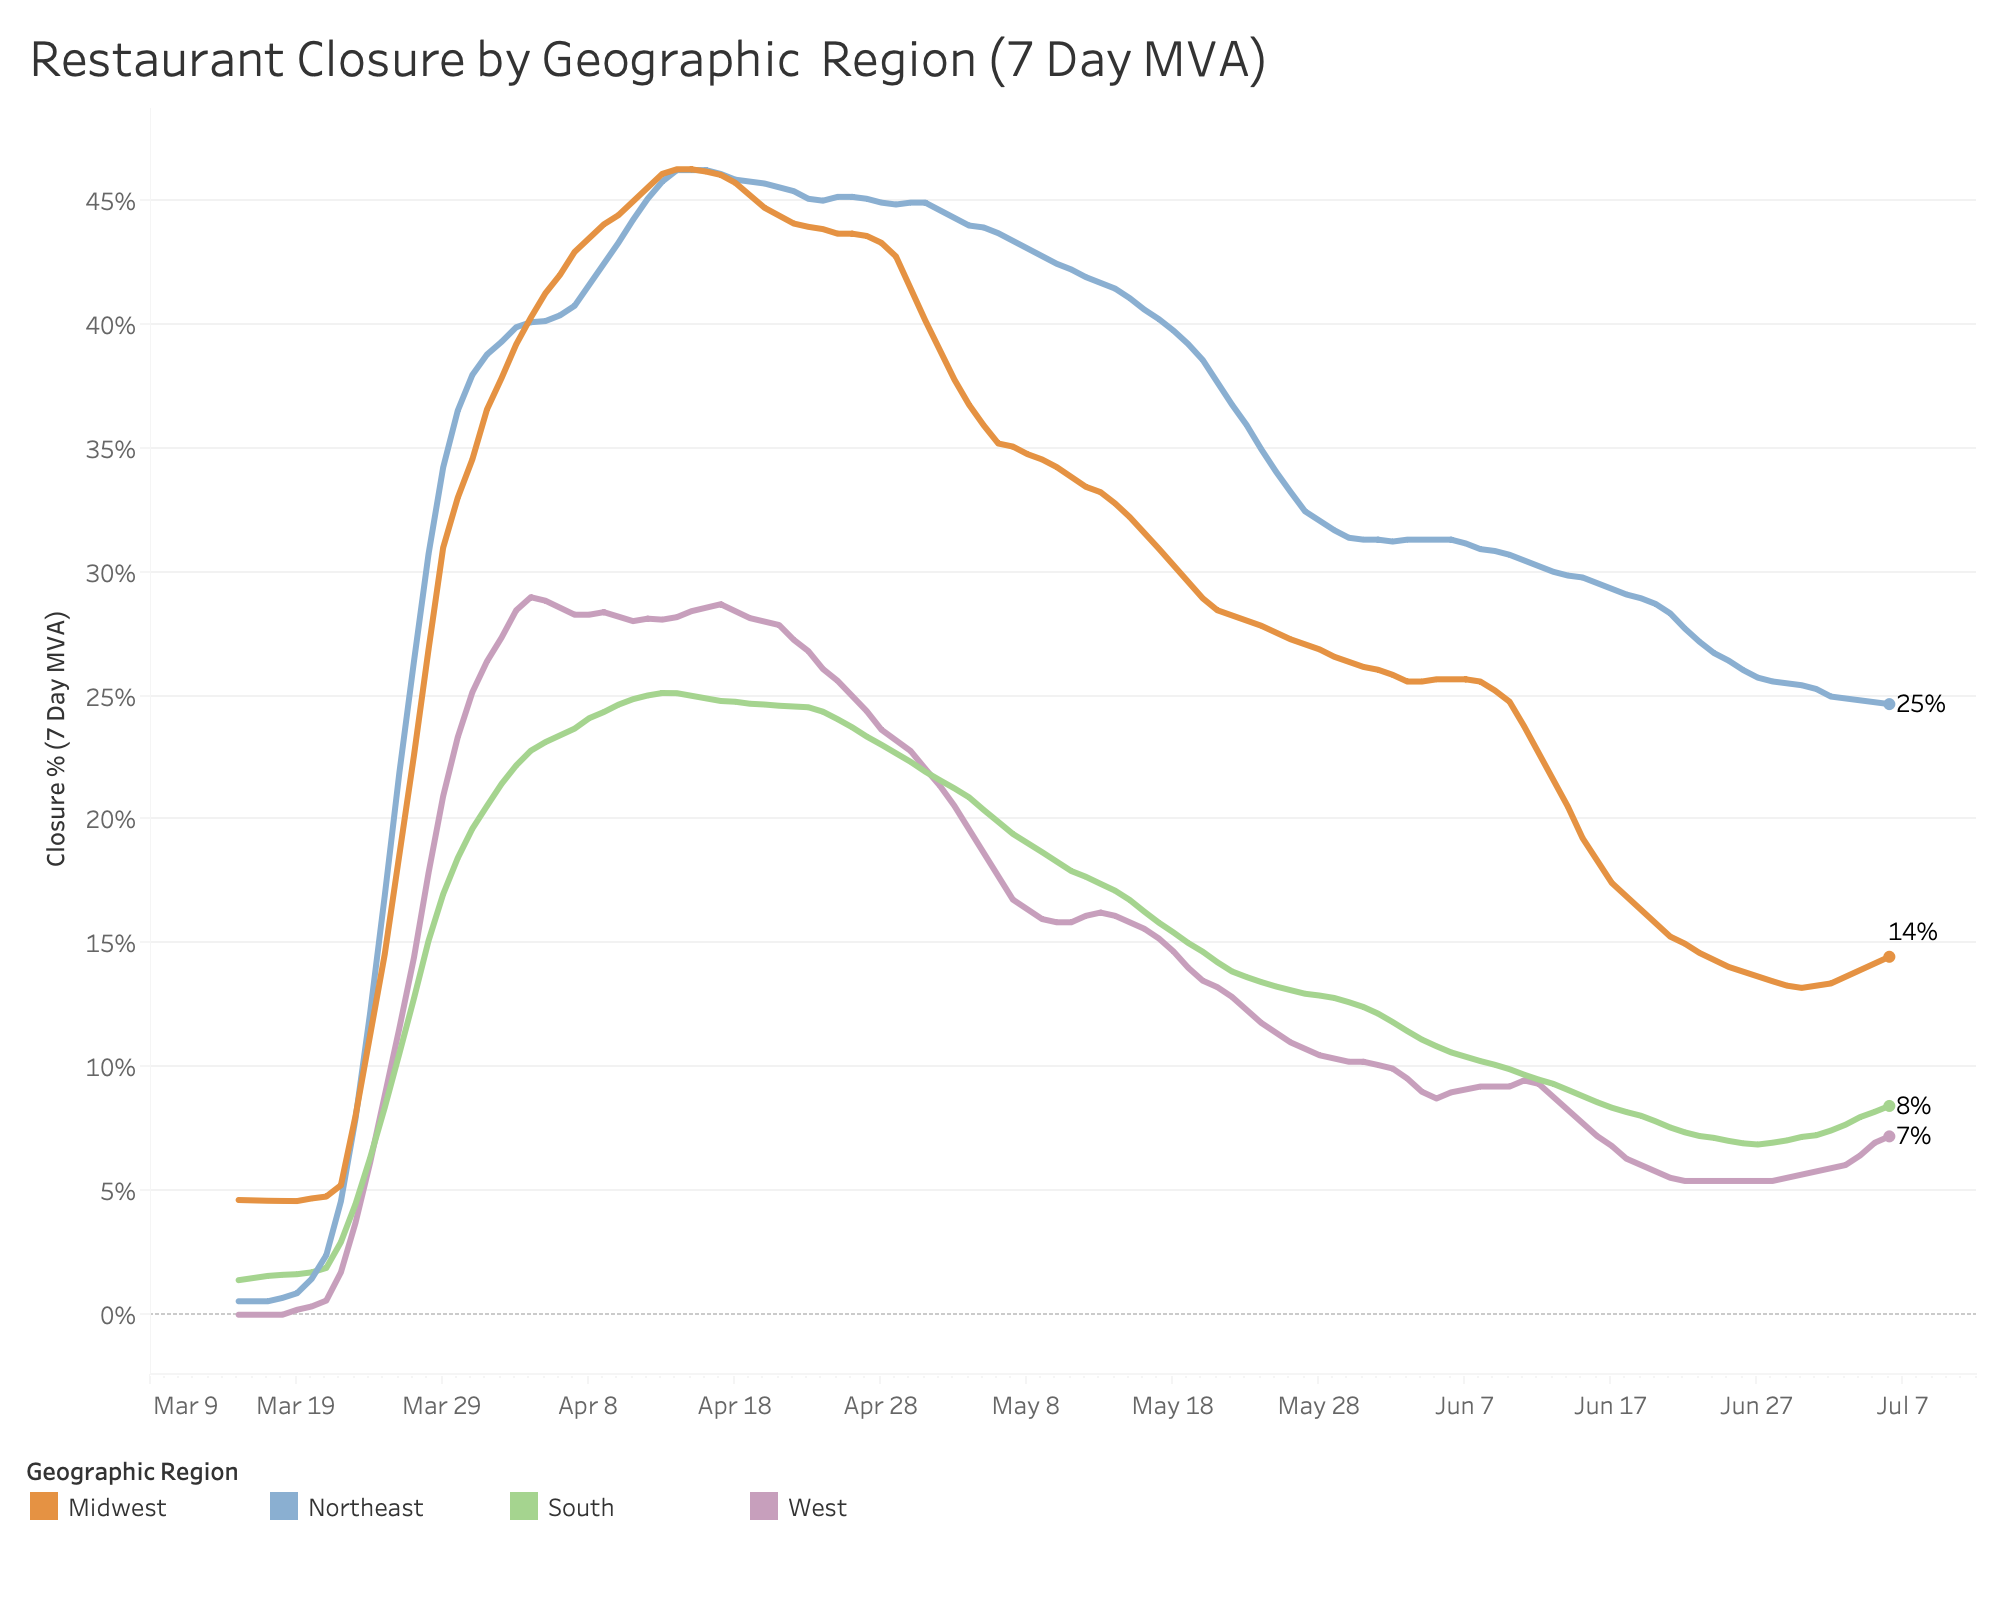
We still have our national view of week-over-week and year-over-year trends, but now you will see closure and sales numbers broken down by region. Not as granular, but also hopefully not so noisy and a little easier to track overall trends.
You can see our shiny new additions below!
Bo
PS – For those following along on these notes, but are not a MarginEdge client, we would love to include your numbers in our data set and continue to build out the value of the reporting. We are giving our MarginEdge Lite product for free for the rest of the year for new clients (normally $15/month). This little tool connects your POS to accounting system and creates journal entries – hopefully time saving for you while increasing our sample size as we track recovery across our network. Obviously no obligation or commitment, just an offer for those interested!
Email Updates
Sign up to receive our emails for sales data, updates and resources as our community navigates Covid-19.
SIGN UP