October 3, 2023
If you’re in the restaurant business, you know there’s not a lot of downtime. As an operator, you maintain a fast pace to keep everything running smoothly and regardless sometimes things will go wrong. But when it comes to your finances, you literally can’t afford mishaps. That’s where easy-to-understand dashboards can save both time and money.
Dashboards translate information into a visual to make data easier for our brains to understand. They make it simpler to view large data sets and see patterns, trends and outliers. Too often restaurants use tabular data, which requires more time to digest and understand. Many operators manually pull data into spreadsheets to graph and analyze data, requiring manual effort and causing delays in information needed for decision-making. This makes it hard to see the big picture in a timely manner, and impossible in real time.
Your restaurant business's profitability and long-term success depend on grasping financial and operational criteria and acting decisively. In today’s environment, selecting the appropriate strategic investments and having the ability to track their performance at various levels is vital to maintaining and increasing margins.
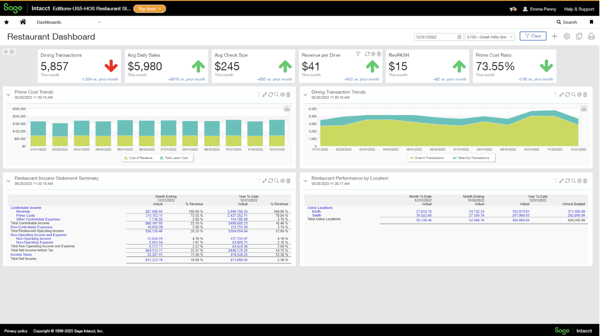
Let’s look at some of the key performance indicators (KPIs) that can help keep your restaurant on track. A top-level dashboard that shows comparisons to a prior period can include:- Number of dining transactions
- Average daily sales
- Average check size
- Revenue per diner
- Revenue per available seating hour
- Prime cost ratio
Positive trending is highlighted in green while negative trending turns red, making it easy to see where everything is headed.
KPIs and metrics can span countless categories, not all of which are financial, but they can help you identify revenue, spending, cash flow and others. Restaurants get their best results by measuring across multiple dimensions within a unified dashboard that presents both financial and statistical data. Restaurants can continuously adapt and improve with a single source of truth. In addition to the top-level dashboard, other trending metrics can include:
- Diner count
- Available seats
- Available seat hours
- Table count
- Dine-in transactions
- Dine-in percentage
- Take-out transactions
- Take-out percentage
- Hourly worker count
- Food cost ratio
- Inventory loss ratio
- Cost-of-goods-sold ratio
- Staff labor cost ratio
- Management cost ratio
- Total labor cost ratio
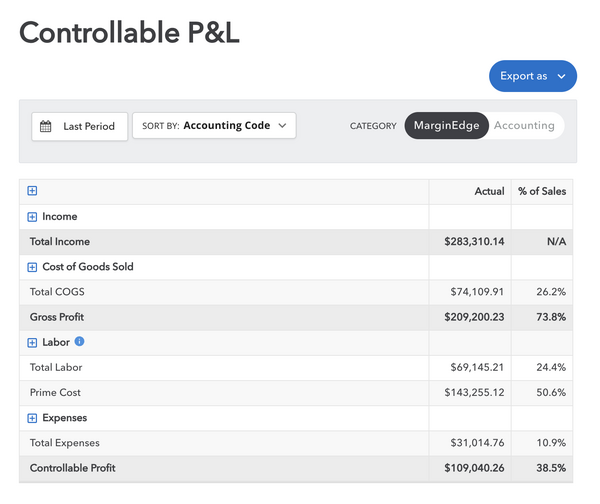
While keeping a pulse on your business day-to-day, for example, by tracking cash flow, prime costs and revenue can help inform your strategy, you may want to broaden your scope and look at other financial and non-financial data to show a rich picture of business performance. Besides tracking the key KPIs that help you measure performance today, here are just a few ways KPIs can help you look long-term and strategize on focus areas:
- Investigate why certain store locations outperform others and analyze the root cause of problems at underperformers, so you can share the learnings across all locations
- Experiment with various digital ordering methods to inform investment decisions regarding your restaurant’s digital ordering platform
- Measure customer satisfaction and the impact of loyalty programs on long-term value
With the right solution, you can analyze your financial data visually across multiple dimensions to quickly digest data and explore your information for deeper understanding on the fly. You can instantly spot trends and patterns, identify outliers, see into the future and more, so you can quickly understand and respond to problems and opportunities.
FAQ
- What is a restaurant accounting dashboard? A restaurant accounting dashboard turns your financial and operational data into clear visuals, so you can spot trends, patterns and outliers at a glance. It pulls KPIs like sales, food cost and prime cost into one place, giving you a single source of truth instead of scattered spreadsheets.
- Which KPIs matter most for restaurant financial reporting? Start with prime cost ratio, food cost ratio, average check size and revenue per available seating hour, since these directly shape your margins. Layer in labor cost ratios, diner counts and dine-in versus take-out percentages to see the full picture of performance.
- How do accounting dashboards improve restaurant profitability? Dashboards give you real-time visibility into costs and sales, so you can catch problems early and act before they eat into your margins. By tracking KPIs across multiple locations, you can compare performance, learn from top performers and make decisions that protect profit.
- How often should restaurant operators review their dashboards? Check top-level metrics like sales, prime cost and cash flow daily to stay ahead of day-to-day swings. For strategic areas like new revenue streams or staffing levels, a weekly or monthly review helps you connect the numbers to your bigger goals.
About Sage Intacct
Choose the flexible and scalable financial platform that delivers deep accounting capabilities, including payroll, tax filings, and inventory tracking tools, across multiple industries designed with a single aim—to accelerate your success. Small to medium-sized businesses prefer Sage Intacct for its ease of use, integrated multi-dimensional reporting, high customer satisfaction, dedicated support and more. Maximize impact and future-proof your business with a partner who can scale with you. Learn more here.
About the author
Bill Fuesz is the hospitality industry principal at Sage Intacct and literally grew up in the restaurant business. He can be reached at bill.fuesz@sage.com.