February 10, 2026
National restaurant sales metrics are here for January 2026!
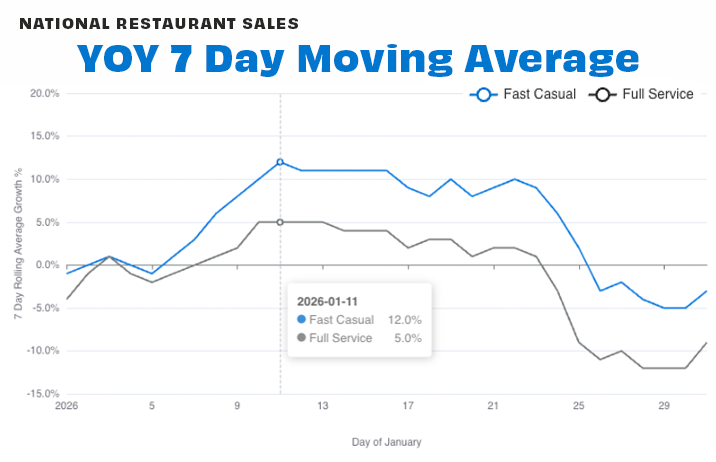
The trailing 4-week (28-day) average of year-over-year (YOY) sales for Fast Casual came in at +4.97% and Full Service at -2.21% at the end of January compared to 2025 sales.
Across the 7-day moving average chart, both segments saw very strong performance throughout the month, peaking at +12% for Fast Casual and +5% for Full Service around January 10th. Both segments dipped towards the end of the month, coinciding with the severe storm that hit the south and eastern regions of the country.
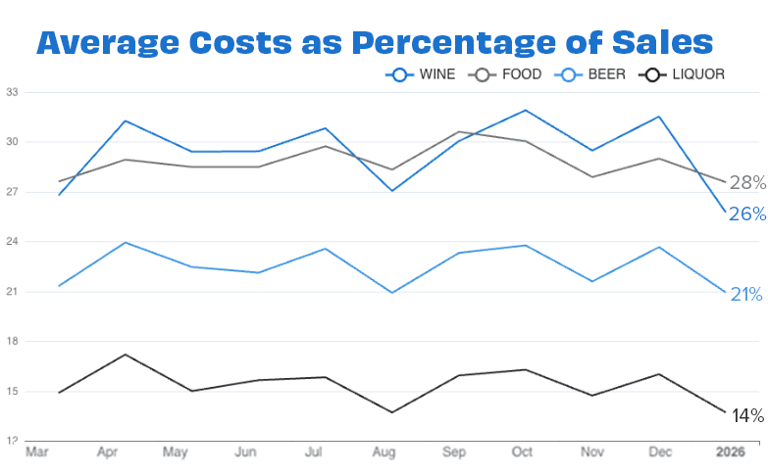
Food costs averaged 28% of sales last month, representing a -1% increase from the average in December.
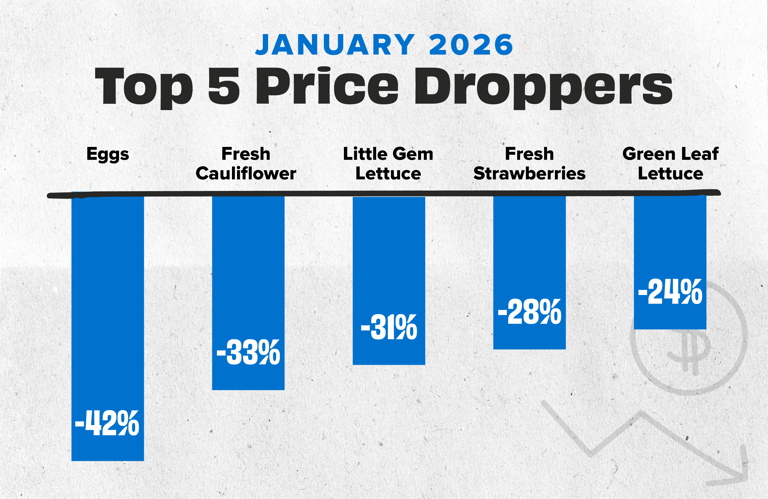
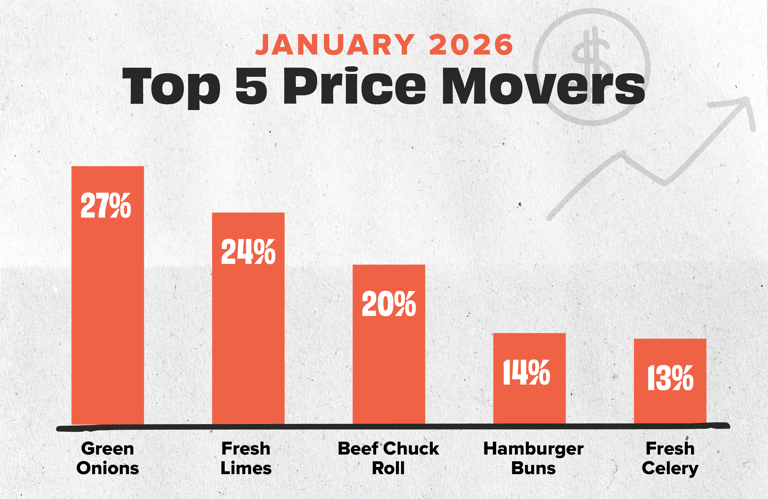
Eggs topped our Droppers list with prices -42% lower on average than in December, followed by fresh cauliflower, down -33%. On our Movers chart, green onion prices were on top again, but with a +27% increase compared to December prices, followed by fresh limes (+24%) and beef chuck roll (+20%).
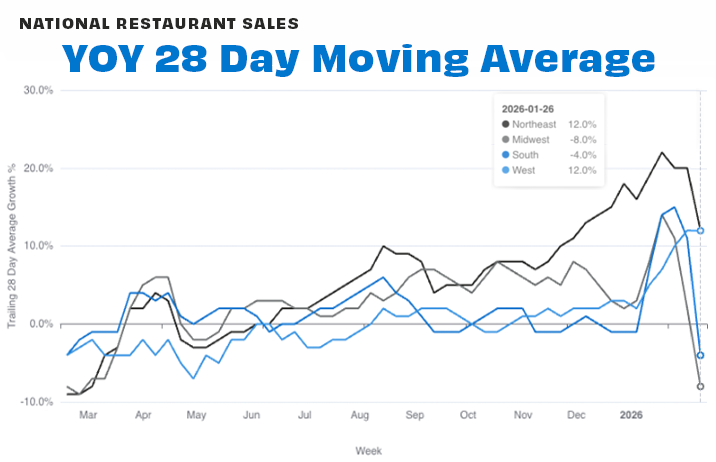
Regionally, the West and the Northeast ended the month with the highest performance, both at +12% growth.
See you in March!
![[Sign up for our newsletter] Get sales data and restaurant insights straight to your inbox each month](https://no-cache.hubspot.com/cta/default/6423873/2b19fcb4-92a7-41e5-8a2f-75a74dad0c24.png)