April 15, 2026
The national restaurant sales metrics for March 2026 are here!
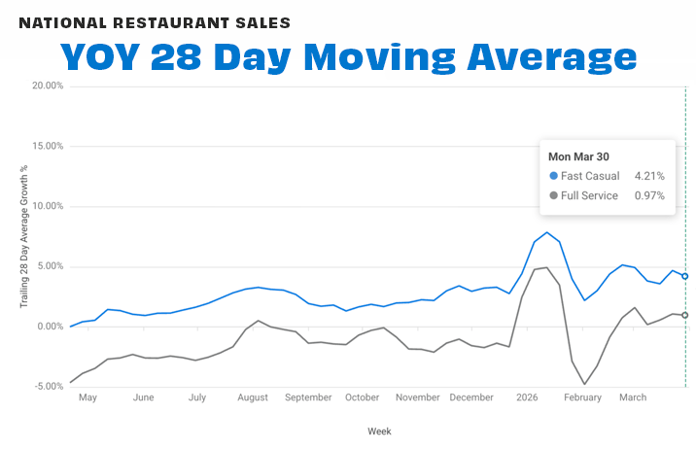
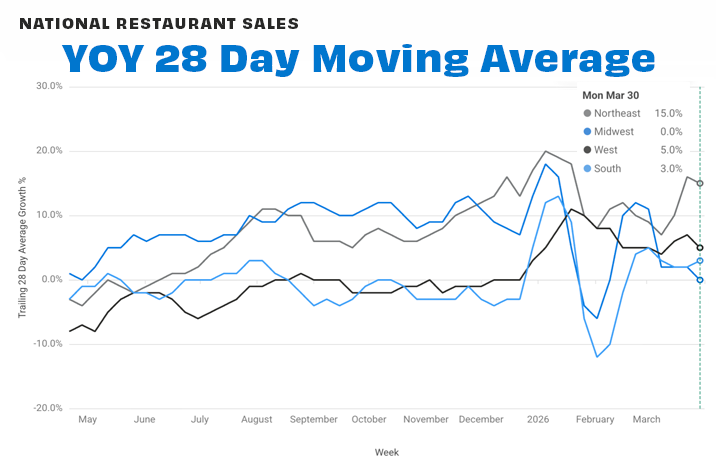
The trailing 4-week (28-day) average of year-over-year (YOY) sales for Fast Casual came in at +4.21% and Full Service at +0.97% at the end of March compared to 2025 sales.
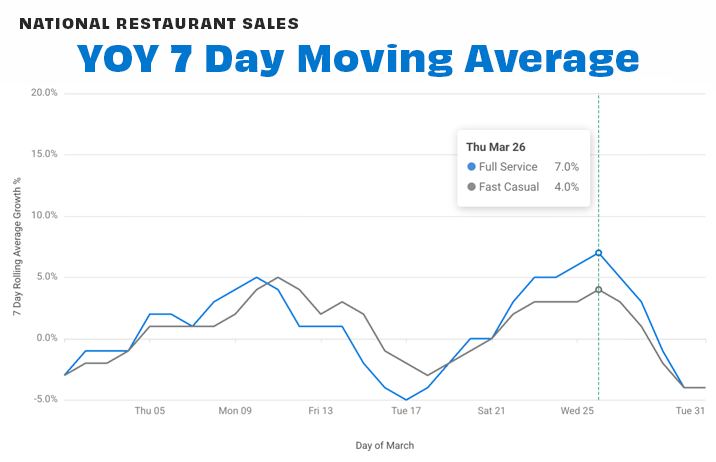
Across the 7-day moving average chart, both segments saw strong growth during the first and last weeks of the month, peaking at +4% growth for Fast Casual and +7% growth for Full Service.
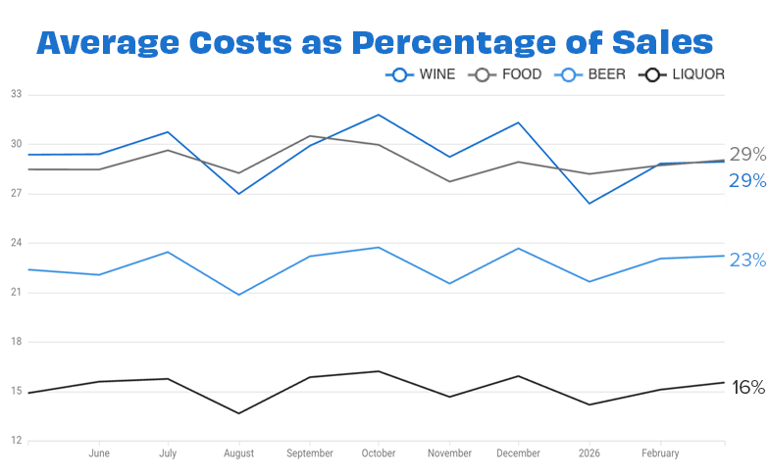
Food costs averaged 29% of sales last month, which was the same in February.
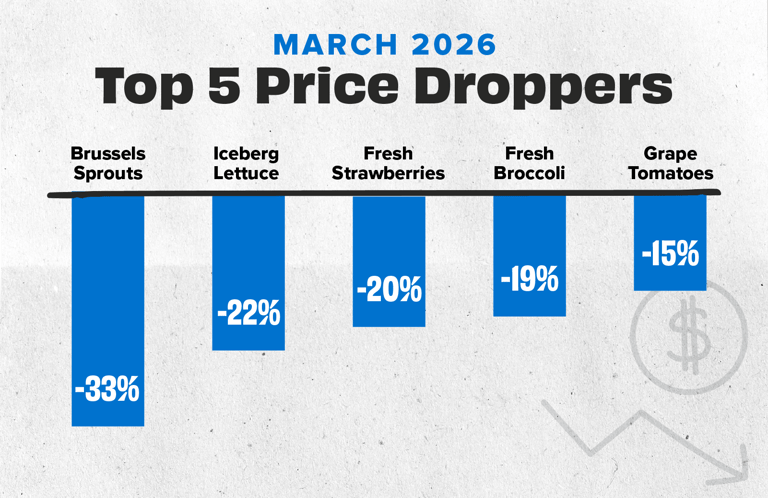
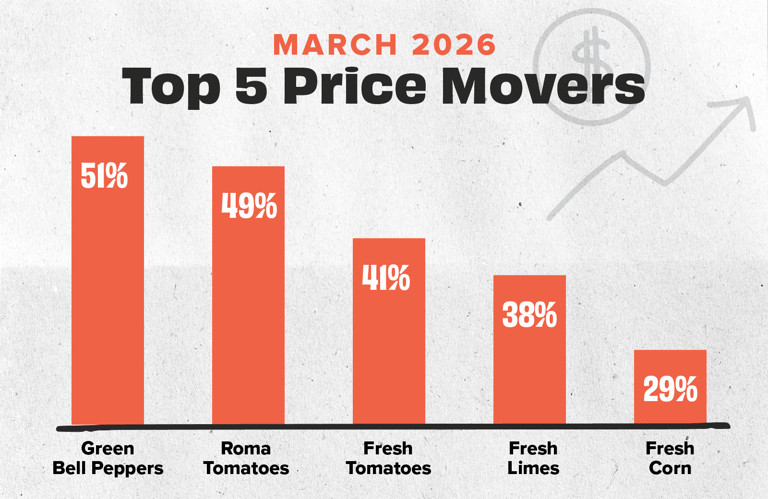
Brussels sprouts topped our Droppers list with prices -33% lower on average than in February, followed by iceberg lettuce, down -22%. On our Movers chart, green bell pepper prices came in with the highest increase at +51% higher than in February, followed by roma tomatoes (+49%) and fresh tomatoes (+41%).
Regionally, the Northeast and the West ended the month with the highest performance, at +15% and +5% growth, respectively.
See you next month!
![[Sign up for our newsletter] Get sales data and restaurant insights straight to your inbox each month](https://no-cache.hubspot.com/cta/default/6423873/2b19fcb4-92a7-41e5-8a2f-75a74dad0c24.png)