December 17, 2025
November 2025 national restaurant sales metrics are in!
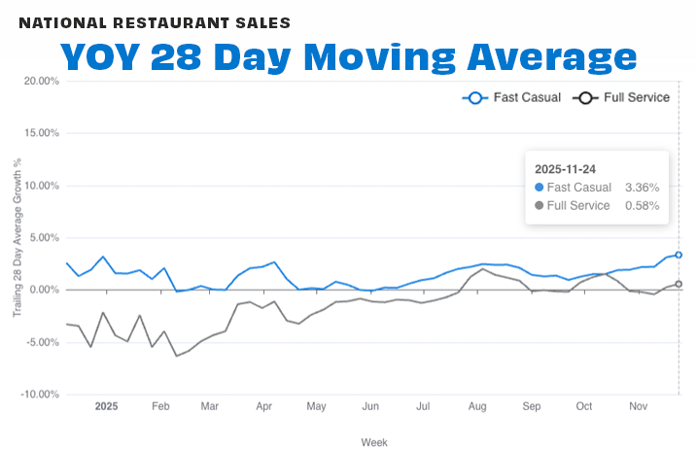
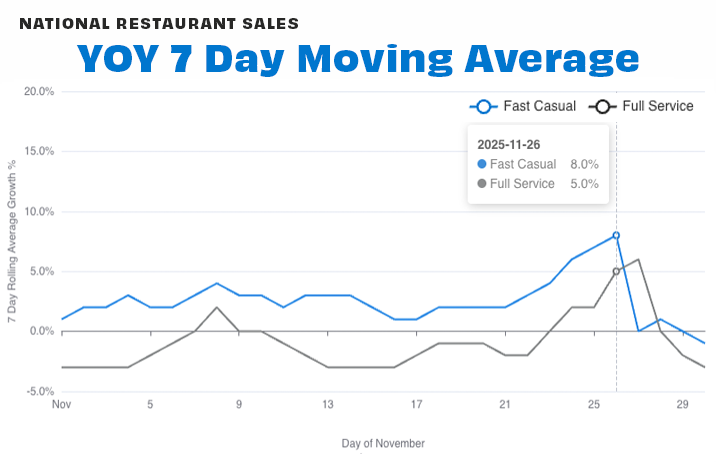
The trailing 4-week (28-day) average of year-over-year (YOY) sales for Fast Casual came in at +3.4% and Full Service at +0.6% at the end of November compared to 2024 sales.
Across the 7-day moving average chart, we saw the strongest performance for both segments over Thanksgiving, particularly with Fast Casual peaking at 8% and Full Service peaking at 6% growth compared to last year.
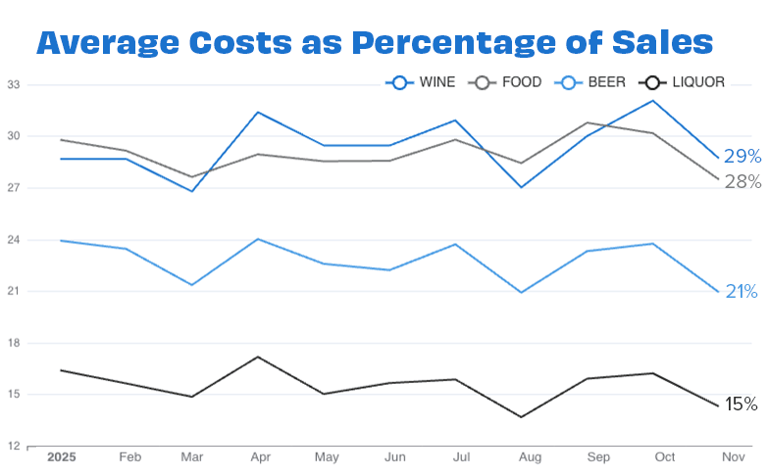
Food costs averaged 28% of sales last month, representing a -1% drop from the average in October.
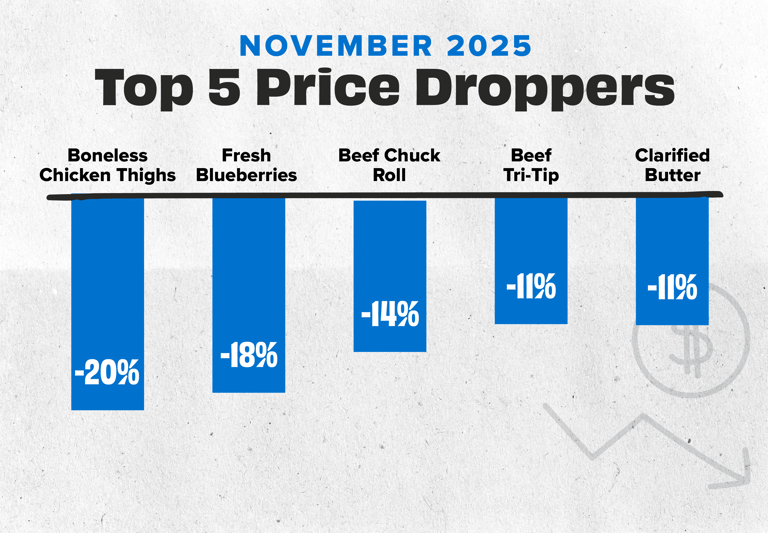
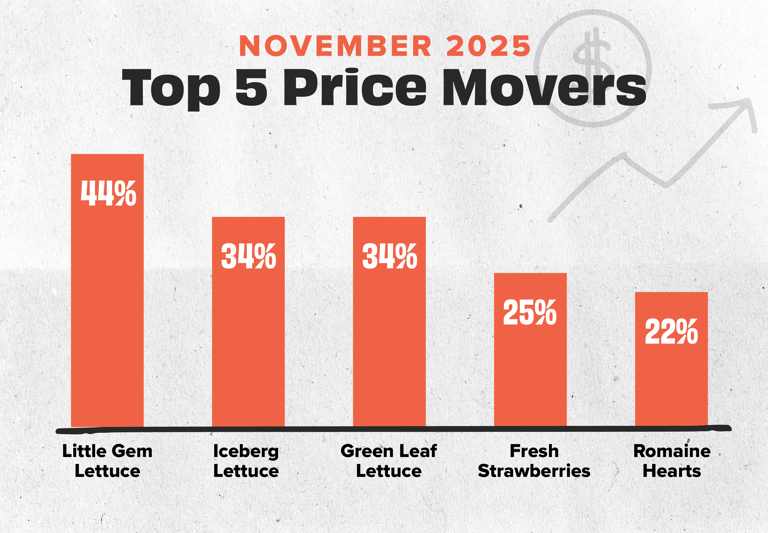
Boneless chicken thighs topped our Droppers list with prices -20% lower on average than in November, followed by blueberries, down -18%. On our Movers chart, little gem lettuce prices had a +44% increase compared to November prices, followed by iceberg lettuce (+34%) and green leaf lettuce (+34%).
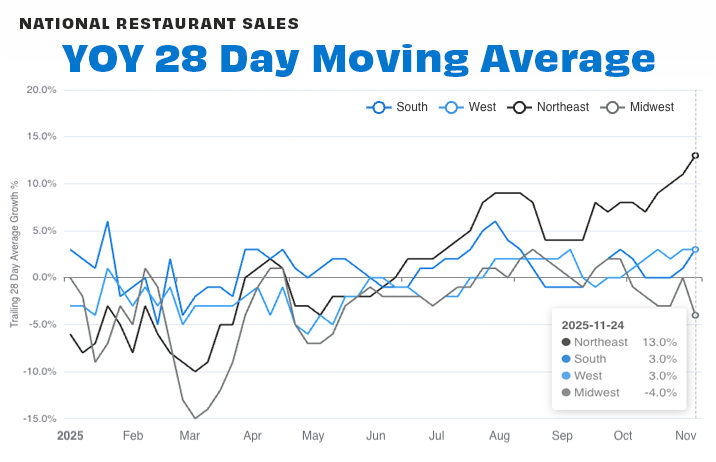
Regionally, most regions saw positive sales all month long, with the Northeast coming in on top, at +13% up from November.
See you in January!
![[Sign up for our newsletter] Get sales data and restaurant insights straight to your inbox each month](https://no-cache.hubspot.com/cta/default/6423873/2b19fcb4-92a7-41e5-8a2f-75a74dad0c24.png)