November 7, 2025
October 2025 national restaurant sales metrics are in!
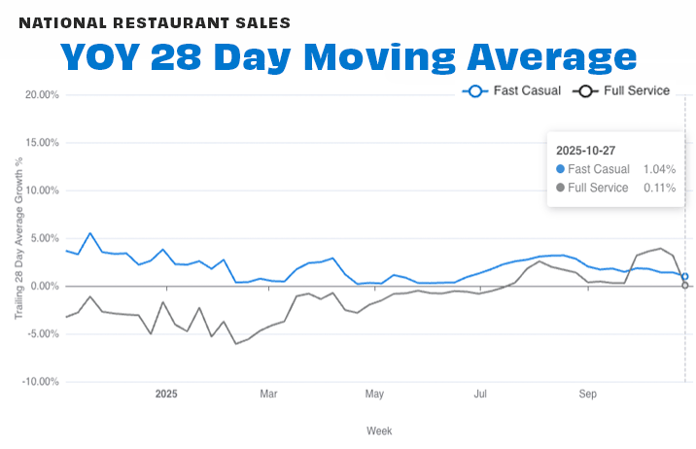
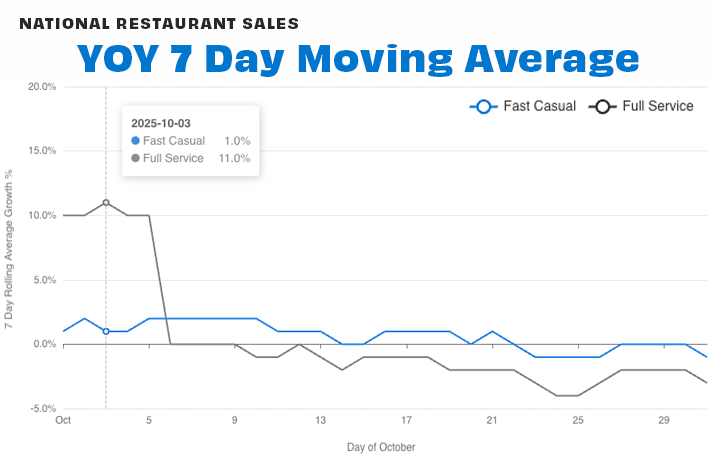
The trailing 4-week (28-day) average of year-over-year (YOY) sales for Fast Casual came in at +1.0% and Full Service at +0.1% at the end of October compared to 2024 sales.
Across the 7-day moving average chart, we saw the strongest performance for both segments at the beginning of the month, particularly with Full Service peaking at 11% growth during the first week of October. Sales slowly declined throughout the month, likely impacted by the government shutdown.
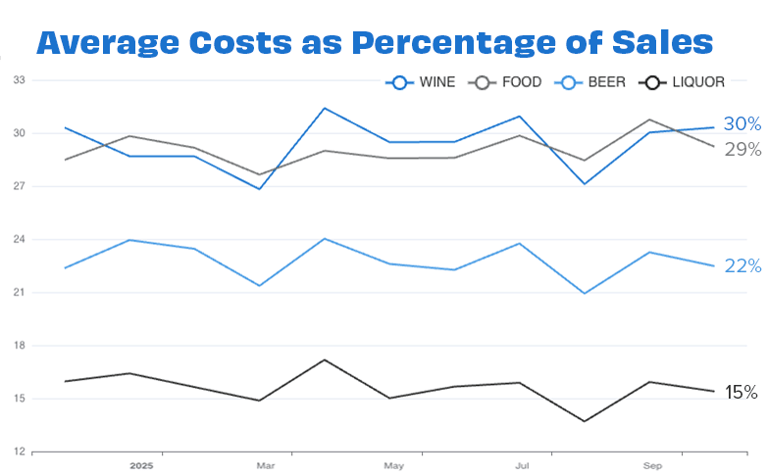
Food costs averaged 29% of sales last month, representing a -1% drop from the average in September.
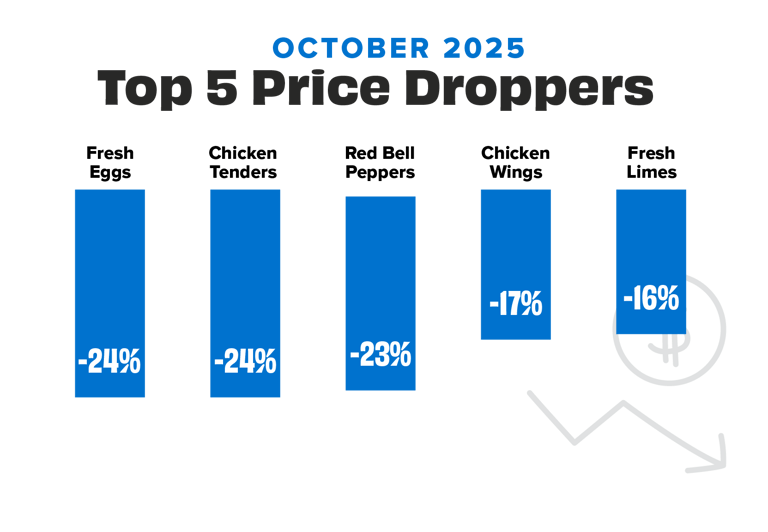
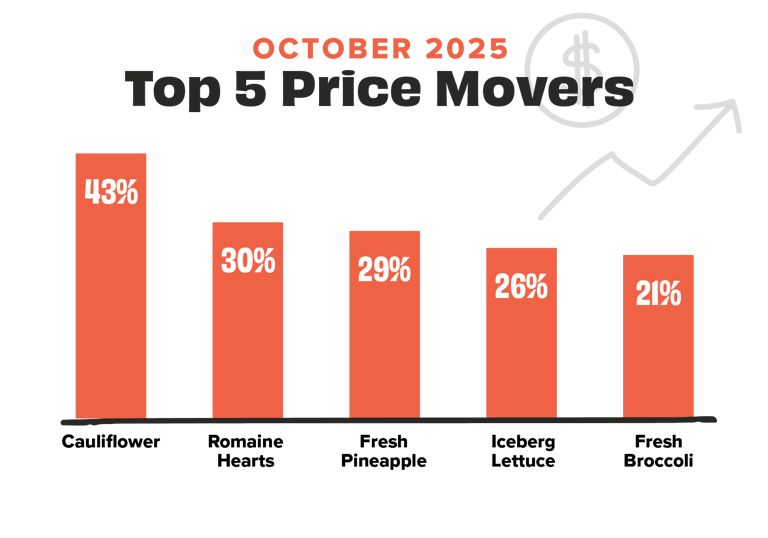
Eggs topped our Droppers list with prices -24% lower on average than in September, followed by chicken tenders, down -24%. On our Movers chart, cauliflower prices had a +43% increase compared to September prices, followed by romaine hearts (+30%) and fresh pineapple (+29%).
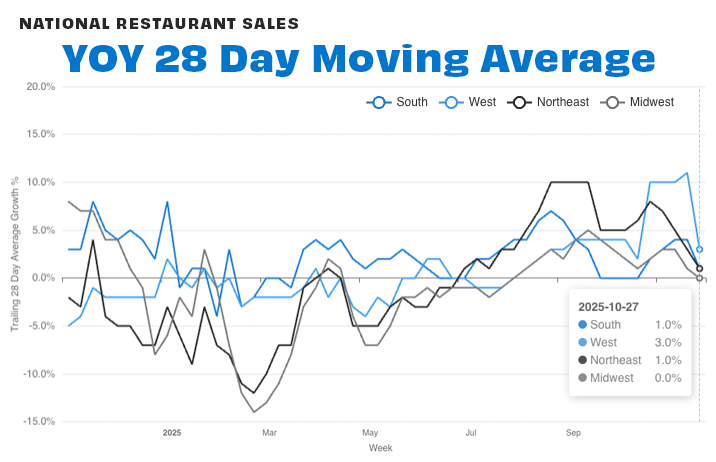
Regionally, every region saw positive sales all month long, with the West coming in on top, at +3% up from September.
See you in December!
![[Sign up for our newsletter] Get sales data and restaurant insights straight to your inbox each month](https://no-cache.hubspot.com/cta/default/6423873/2b19fcb4-92a7-41e5-8a2f-75a74dad0c24.png)